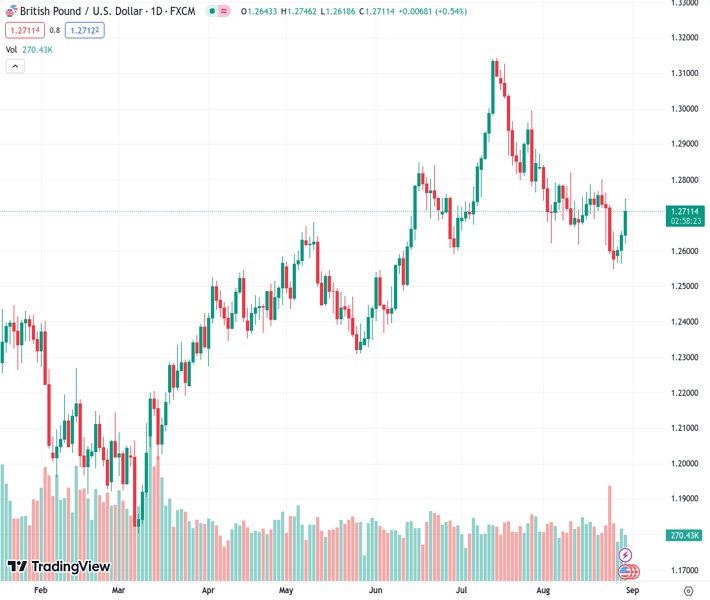
The GBPUSD pair is currently trading at a level of 1.2710, showing a increase of 0.58%. This rise has been supported by disappointing US employment figures and a downward adjustment of the second quarter GDP to 2.1%.
…
This is a premium post.
[s2If !current_user_can(access_s2member_level4)]Please register for FREE REGISTER to read full post below containing analysis. In case of any error or you think you are not able to read the full post below, please email us at support#nehcap.com [lwa][/s2If] [s2If current_user_can(access_s2member_level1)]
- GBP/USD trades at 1.2710, up 0.58%, buoyed by weaker-than-expected US jobs data and a downward revision of Q2 GDP to 2.1%.
The pair currently trades last at 1.27128.
The previous day high was 1.2655 while the previous day low was 1.2563. The daily 38.2% Fib levels comes at 1.262, expected to provide support. Similarly, the daily 61.8% fib level is at 1.2598, expected to provide support.
Pound Sterling (GBP) advances for three consecutive days against the US Dollar (USD) amid a light economic calendar in the UK. A busy economic week for the United States (US), particularly leaning into jobs data, decreased the Federal Reserve’s odds of hiking rates for the remainder of the year. The GBP/USD is exchanging hands at around 1.2710 above its opening price by 0.58%.
Following last Tuesday’s worse-than-expected job openings report, August’s ADP National Employment report was no exception. The data showed companies hired less than estimates of 195K and added 177K jobs to the economy, indicating the labor market is losing traction. Speculation the Fed would not increase borrowing costs could be reflected in the CME FEdWatch Tool, with investors cutting their bets for a rate hike In November.
Other data showed the economy is deteriorating, with the second estimate of Q2 Gross Domestic Product (GDP) coming at 2.1%, below the previously reported 2.4%, signaling the economy is decelerating.
The GBP/USD reacted upwards and pierced the 1.2700 figure, which was broken to the downside on August 24, with the pair finishing the session at around 1.2591. Nevertheless, data in the last few days propelled the Sterling, while the Greenback bleeds as the US Treasury bond yield slides.
The US Dollar Index (DXY), which tracks the performance of six currencies vs. the US Dollar, prints losses of 0.38%, at 103.089.
Across the pond, additional rate hikes expected by the Bank of Englan (BoE) underpin the Cable. Market participants estimate the Bank Rate would peak at around 5.8%. In the meantime, a BoE report showed that British consumers increased their borrowing less than expected as higher rates bite its citizens.
Aside from this, upcoming data from the US, notably the Federal Reserve’s preferred gauge for inflation, the Personal Consumption Expenditures (PCE), and further labor market data would give direction to the GBP/USD pair.
Once the GBP/USD pair reclaimed 1.2700, the major is set to test the 50-day Moving Average (DMA) at 1.2779 in the short term, followed by the 1.2800 figure. If those two resistance levels are breached, the July 27 daily high, at 1.2995, could be up next. Conversely, if the pair slumps below 1.2700, further downside is expected at the current week’s low of 1.2548.
Technical Levels: Supports and Resistances
GBPUSD currently trading at 1.2726 at the time of writing. Pair opened at 1.2644 and is trading with a change of 0.65 % .
| Overview | Overview.1 | |
|---|---|---|
| 0 | Today last price | 1.2726 |
| 1 | Today Daily Change | 0.0082 |
| 2 | Today Daily Change % | 0.6500 |
| 3 | Today daily open | 1.2644 |
The pair is trading above its 20 Daily moving average @ 1.2702, below its 50 Daily moving average @ 1.2782 , above its 100 Daily moving average @ 1.2644 and above its 200 Daily moving average @ 1.2407
| Trends | Trends.1 | |
|---|---|---|
| 0 | Daily SMA20 | 1.2702 |
| 1 | Daily SMA50 | 1.2782 |
| 2 | Daily SMA100 | 1.2644 |
| 3 | Daily SMA200 | 1.2407 |
The previous day high was 1.2655 while the previous day low was 1.2563. The daily 38.2% Fib levels comes at 1.262, expected to provide support. Similarly, the daily 61.8% fib level is at 1.2598, expected to provide support.
Note the levels of interest below:
- Pivot support is noted at 1.2586, 1.2528, 1.2494
- Pivot resistance is noted at 1.2678, 1.2713, 1.277
| Levels | Levels.1 |
|---|---|
| Previous Daily High | 1.2655 |
| Previous Daily Low | 1.2563 |
| Previous Weekly High | 1.2800 |
| Previous Weekly Low | 1.2548 |
| Previous Monthly High | 1.3142 |
| Previous Monthly Low | 1.2659 |
| Daily Fibonacci 38.2% | 1.2620 |
| Daily Fibonacci 61.8% | 1.2598 |
| Daily Pivot Point S1 | 1.2586 |
| Daily Pivot Point S2 | 1.2528 |
| Daily Pivot Point S3 | 1.2494 |
| Daily Pivot Point R1 | 1.2678 |
| Daily Pivot Point R2 | 1.2713 |
| Daily Pivot Point R3 | 1.2770 |
[/s2If]
Download Nehcap EAWe have two EAs that are operational on our LIVE accounts.
- EA-FIX: Check out the details here. Download EA-FIX . EA-FIX is a non-grid HFT scalper.
- EA-GROWTH: High quality low dd EA using trend grids. Download EA_GROWTHJoin Our Telegram Group
")


