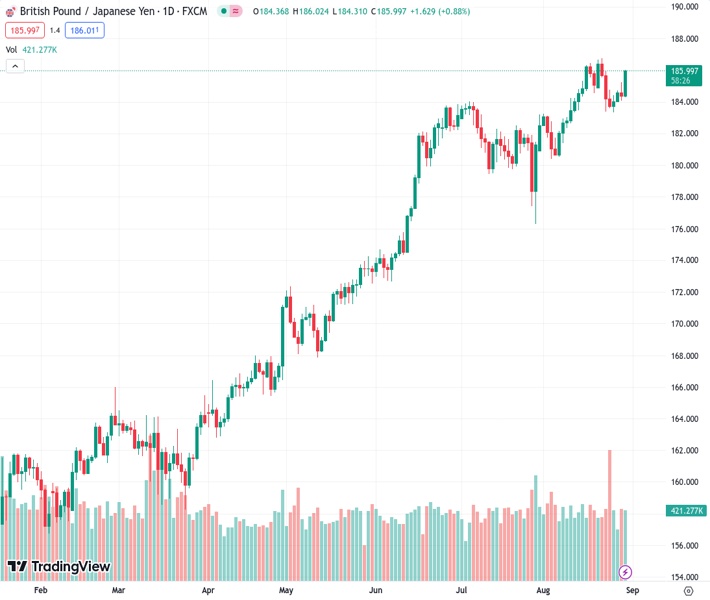
The GBPJPY currency pair, currently at 186.007, experiences a significant increase to 185.90. This surge results in a gain of over 150 pips or 0.88%. The reason behind this upward movement is the release of US economic data, which decreases the probability of the Federal Reserve implementing interest rate increases.
…
This is a premium post.
[s2If !current_user_can(access_s2member_level4)]Please register for FREE REGISTER to read full post below containing analysis. In case of any error or you think you are not able to read the full post below, please email us at support#nehcap.com [lwa][/s2If] [s2If current_user_can(access_s2member_level1)]
- GBP/JPY surges to 185.90, gaining more than 150 pips or 0.88%, as US economic data reduces the likelihood of Fed rate hikes.
The pair currently trades last at 186.007.
The previous day high was 185.27 while the previous day low was 184.07. The daily 38.2% Fib levels comes at 184.53, expected to provide support. Similarly, the daily 61.8% fib level is at 184.81, expected to provide support.
The GBP/JPY rallied sharply on Wednesday, gaining more than 150 pips or 0.88%, as market sentiment remains upbeat, following the release of US economic data that could deter the US central bank from hiking rates. The pair is trading at 185.90 after hitting a daily low of 184.31.
On Wednesday, the GBP/JPY broke above the Tenkan-Sen line, opening the door for further upside, putting into play the 186.00 mark, followed by the year-to-date (YTD) high of 186.76. Conversely, a daily close below 186.00 could exacerbate a re-test of the Tenkan-Sen line at 185.05, followed by the current week’s low of 183.35.
Short-term, the GBP/JPY 4-hour chart portrays the pair as upward biased, and after cracking above the Ichimoku Cloud (Kumo), the cross is extending its gains. First resistance emerges at the 186.00 figure, followed by December’s 2015 high of 186.35, before testing the year-to-date (YTD) high of 186.76.
Contrarily, if GBP/JPY edges lower, the first support would emerge at 185.06, the confluence of the Tenkan-Sen and the top of the Kumo, followed by the Kijun-Sen line at 184.68.
Technical Levels: Supports and Resistances
GBPJPY currently trading at 186.0 at the time of writing. Pair opened at 184.44 and is trading with a change of 0.85 % .
| Overview | Overview.1 | |
|---|---|---|
| 0 | Today last price | 186.00 |
| 1 | Today Daily Change | 1.56 |
| 2 | Today Daily Change % | 0.85 |
| 3 | Today daily open | 184.44 |
The pair remains strongly bullish on the daily timeframe. It trades above its 20 SMA @ 184.0, 50 SMA 182.8, 100 SMA @ 177.22 and 200 SMA @ 169.72.
| Trends | Trends.1 | |
|---|---|---|
| 0 | Daily SMA20 | 184.00 |
| 1 | Daily SMA50 | 182.80 |
| 2 | Daily SMA100 | 177.22 |
| 3 | Daily SMA200 | 169.72 |
The previous day high was 185.27 while the previous day low was 184.07. The daily 38.2% Fib levels comes at 184.53, expected to provide support. Similarly, the daily 61.8% fib level is at 184.81, expected to provide support.
Note the levels of interest below:
- Pivot support is noted at 183.92, 183.4, 182.72
- Pivot resistance is noted at 185.12, 185.79, 186.31
| Levels | Levels.1 |
|---|---|
| Previous Daily High | 185.27 |
| Previous Daily Low | 184.07 |
| Previous Weekly High | 186.77 |
| Previous Weekly Low | 183.36 |
| Previous Monthly High | 184.02 |
| Previous Monthly Low | 176.32 |
| Daily Fibonacci 38.2% | 184.53 |
| Daily Fibonacci 61.8% | 184.81 |
| Daily Pivot Point S1 | 183.92 |
| Daily Pivot Point S2 | 183.40 |
| Daily Pivot Point S3 | 182.72 |
| Daily Pivot Point R1 | 185.12 |
| Daily Pivot Point R2 | 185.79 |
| Daily Pivot Point R3 | 186.31 |
[/s2If]
Download Nehcap EAWe have two EAs that are operational on our LIVE accounts.
- EA-FIX: Check out the details here. Download EA-FIX . EA-FIX is a non-grid HFT scalper.
- EA-GROWTH: High quality low dd EA using trend grids. Download EA_GROWTHJoin Our Telegram Group
")


