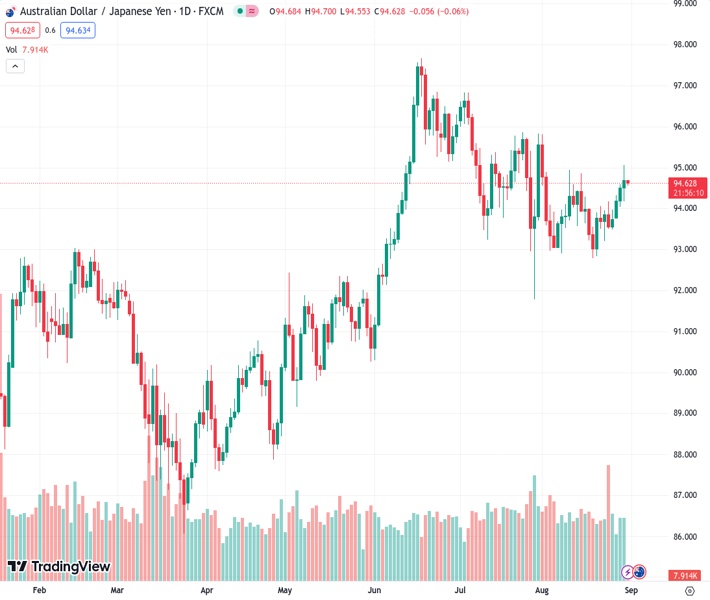
The currency pair AUDJPY, currently trading at 94.58, has decreased by 0.11%. It is nearing the Ichimoku Cloud, suggesting a potential change from a neutral outlook to a positive one.
…
This is a premium post.
[s2If !current_user_can(access_s2member_level4)]Please register for FREE REGISTER to read full post below containing analysis. In case of any error or you think you are not able to read the full post below, please email us at support#nehcap.com [lwa][/s2If] [s2If current_user_can(access_s2member_level1)]
- AUD/JPY trades at 94.58, down 0.11%, as it approaches the Ichimoku Cloud, indicating a possible shift from a neutral to upward bias.
The pair currently trades last at 94.6350.
The previous day high was 94.6 while the previous day low was 94.05. The daily 38.2% Fib levels comes at 94.39, expected to provide support. Similarly, the daily 61.8% fib level is at 94.26, expected to provide support.
The Australian Dollar (AUD) registers minuscule losses vs. the Japanese Yen (JPY) as Thursday’s Asian session begins and is threatening to break above the Ichimoku Cloud (Kumo), which would open the door for further upside. At the time of writing, the AUD/JPY is trading at 94.58, down 0.11%.
The cross-currency pair daily chart portrays the par as neutral to downward biased, but it could shift to neutral if the AUD/JPY clears the top of the Kumo. In that event, the first resistance to test would be the August 30 high of 95.06, followed by the July 31 swing high at 95.83. Nevertheless, as the AUD/JPY formed a spinning top, price action could remain trapped within Wednesday’s high and low. If that scenario is about to play out, the pair could create a ‘bearish-harami’ candlestick pattern, which could pave the way for further losses.
In that event, the first support would be the August 30 low of 94.17, followed by the 94.00 figure. A breach of the latter will expose the Senkou-Span A at 93.87, followed by the August 21 low of 92.83.
Technical Levels: Supports and Resistances
AUDJPY currently trading at 94.61 at the time of writing. Pair opened at 94.53 and is trading with a change of 0.08 % .
| Overview | Overview.1 | |
|---|---|---|
| 0 | Today last price | 94.61 |
| 1 | Today Daily Change | 0.08 |
| 2 | Today Daily Change % | 0.08 |
| 3 | Today daily open | 94.53 |
The pair is trading above its 20 Daily moving average @ 93.82, below its 50 Daily moving average @ 94.7 , above its 100 Daily moving average @ 93.18 and above its 200 Daily moving average @ 91.91
| Trends | Trends.1 | |
|---|---|---|
| 0 | Daily SMA20 | 93.82 |
| 1 | Daily SMA50 | 94.70 |
| 2 | Daily SMA100 | 93.18 |
| 3 | Daily SMA200 | 91.91 |
The previous day high was 94.6 while the previous day low was 94.05. The daily 38.2% Fib levels comes at 94.39, expected to provide support. Similarly, the daily 61.8% fib level is at 94.26, expected to provide support.
Note the levels of interest below:
- Pivot support is noted at 94.18, 93.84, 93.63
- Pivot resistance is noted at 94.74, 94.94, 95.29
| Levels | Levels.1 |
|---|---|
| Previous Daily High | 94.60 |
| Previous Daily Low | 94.05 |
| Previous Weekly High | 94.18 |
| Previous Weekly Low | 92.83 |
| Previous Monthly High | 96.84 |
| Previous Monthly Low | 91.79 |
| Daily Fibonacci 38.2% | 94.39 |
| Daily Fibonacci 61.8% | 94.26 |
| Daily Pivot Point S1 | 94.18 |
| Daily Pivot Point S2 | 93.84 |
| Daily Pivot Point S3 | 93.63 |
| Daily Pivot Point R1 | 94.74 |
| Daily Pivot Point R2 | 94.94 |
| Daily Pivot Point R3 | 95.29 |
[/s2If]
Download Nehcap EAWe have two EAs that are operational on our LIVE accounts.
- EA-FIX: Check out the details here. Download EA-FIX . EA-FIX is a non-grid HFT scalper.
- EA-GROWTH: High quality low dd EA using trend grids. Download EA_GROWTHJoin Our Telegram Group
")


