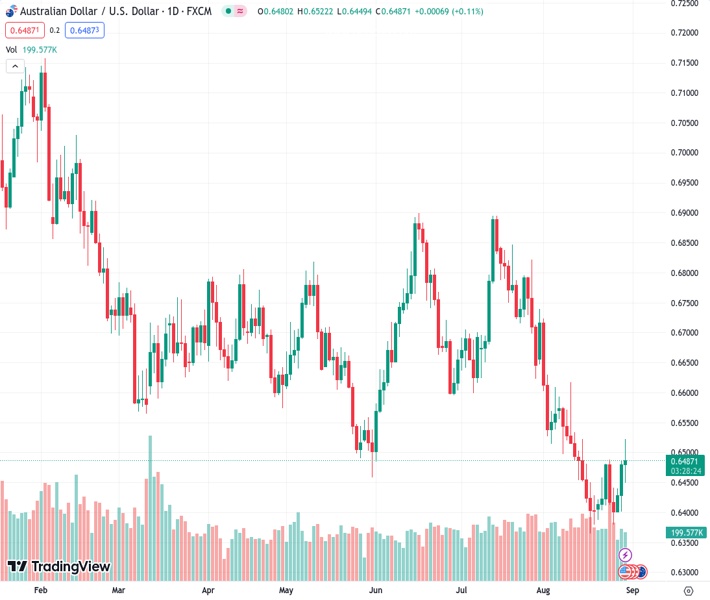
The AUDUSD currency pair increased to approximately 0.6490 from 0.64873 and remained steady above the 20-day simple moving average (SMA) of 0.6473.
…
This is a premium post.
[s2If !current_user_can(access_s2member_level4)]Please register for FREE REGISTER to read full post below containing analysis. In case of any error or you think you are not able to read the full post below, please email us at support#nehcap.com [lwa][/s2If] [s2If current_user_can(access_s2member_level1)]
- AUD/USD rose near 0.6490 and consolidated above the 20-day SMA of 0.6473.
The pair currently trades last at 0.64873.
The previous day high was 0.6487 while the previous day low was 0.6401. The daily 38.2% Fib levels comes at 0.6454, expected to provide support. Similarly, the daily 61.8% fib level is at 0.6434, expected to provide support.
In Wednesday’s session, the AUD/USD gained traction, as the USD is trading weak against most of its rivals following fresh soft employment figures. On the Aussie front, Australia reported weak housing data during the Asian session, while the Monthly Consumer Price Index (CPI) dropped to 4.9% YoY.
The ADP Employment Change figures from the US missed the consensus in August. The figure came in at 177,000, while the markets expected 195,000, significantly lower than the last reading of 371,000. In addition, the Q2 Gross Domestic Product (GDP) was revised
downwards to 2.1% YoY. The immediate reaction to the lower-than-expected ADPs and JOLTs from Tuesday was hopes that the tightening cycle from the Fed would end, which fueled a sharp decline in the 2,5 and 10-year yields to their lowest in three weeks. However, the CME FedWatch tool reflects that the odds of a hike in the November meeting slightly fell, but they remain high, around 44%. In addition, investors are pricing in that the Fed will cut rates sooner, in June 2024, which also weakens the USD.
That being said, before the September 20 meeting, the Fed will get an additional Nonfarm Payrolls (NFP) report this Friday, a Core Personal Consumption Expenditures (PCE) reading on Thursday and a Consumer Price Index (CPI) figures from August next Friday. Those inflation figures will likely weigh more on the Fed’s upcoming decisions.
The daily chart analysis indicates a neutral to bullish outlook for the AUD/USD in the short term. The Relative Strength Index (RSI) is below its midline in negative territory but with a positive slope, aligning with the negative signal from the Moving Average Convergence Divergence (MACD), which displays rising green bars, suggesting that the bulls are slowly regaining momentum. Additionally, bullish signals on the four-hour chart indicate a forceful buying momentum, establishing a marked bull dominance over sellers in the shorter time frame.
Support levels: 0.6475 (20-day SMA), 0.6400, 0.6380.
Resistance levels: 0.6500, 0.6525, 0.6540.
Technical Levels: Supports and Resistances
AUDUSD currently trading at 0.6488 at the time of writing. Pair opened at 0.648 and is trading with a change of 0.12 % .
| Overview | Overview.1 | |
|---|---|---|
| 0 | Today last price | 0.6488 |
| 1 | Today Daily Change | 0.0008 |
| 2 | Today Daily Change % | 0.1200 |
| 3 | Today daily open | 0.6480 |
The pair is trading above its 20 Daily moving average @ 0.6477, below its 50 Daily moving average @ 0.6622 , below its 100 Daily moving average @ 0.6651 and below its 200 Daily moving average @ 0.6726
| Trends | Trends.1 | |
|---|---|---|
| 0 | Daily SMA20 | 0.6477 |
| 1 | Daily SMA50 | 0.6622 |
| 2 | Daily SMA100 | 0.6651 |
| 3 | Daily SMA200 | 0.6726 |
The previous day high was 0.6487 while the previous day low was 0.6401. The daily 38.2% Fib levels comes at 0.6454, expected to provide support. Similarly, the daily 61.8% fib level is at 0.6434, expected to provide support.
Note the levels of interest below:
- Pivot support is noted at 0.6425, 0.6371, 0.634
- Pivot resistance is noted at 0.6511, 0.6542, 0.6597
| Levels | Levels.1 |
|---|---|
| Previous Daily High | 0.6487 |
| Previous Daily Low | 0.6401 |
| Previous Weekly High | 0.6488 |
| Previous Weekly Low | 0.6380 |
| Previous Monthly High | 0.6895 |
| Previous Monthly Low | 0.6599 |
| Daily Fibonacci 38.2% | 0.6454 |
| Daily Fibonacci 61.8% | 0.6434 |
| Daily Pivot Point S1 | 0.6425 |
| Daily Pivot Point S2 | 0.6371 |
| Daily Pivot Point S3 | 0.6340 |
| Daily Pivot Point R1 | 0.6511 |
| Daily Pivot Point R2 | 0.6542 |
| Daily Pivot Point R3 | 0.6597 |
[/s2If]
Download Nehcap EAWe have two EAs that are operational on our LIVE accounts.
- EA-FIX: Check out the details here. Download EA-FIX . EA-FIX is a non-grid HFT scalper.
- EA-GROWTH: High quality low dd EA using trend grids. Download EA_GROWTHJoin Our Telegram Group
")


