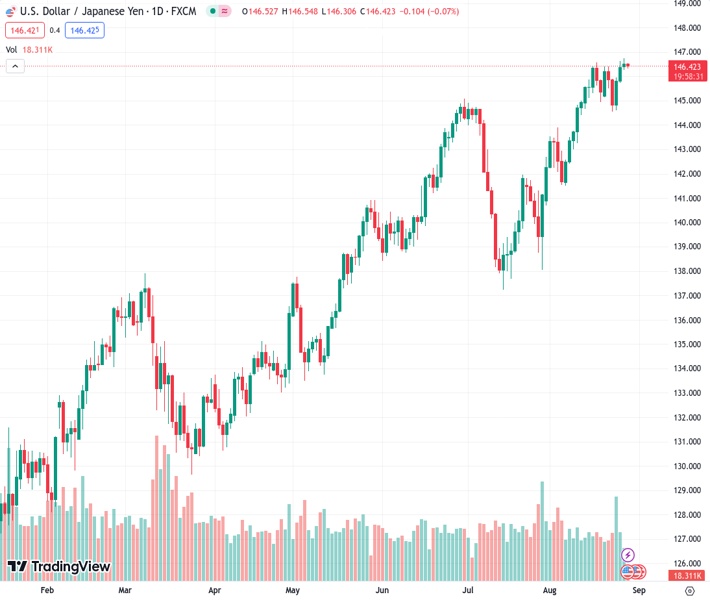
On Tuesday, the USDJPY pair declined to 146.455, breaking its three-day winning streak and dropping from its highest point of the year.
…
This is a premium post.
[s2If !current_user_can(access_s2member_level4)]Please register for FREE REGISTER to read full post below containing analysis. In case of any error or you think you are not able to read the full post below, please email us at support#nehcap.com [lwa][/s2If] [s2If current_user_can(access_s2member_level1)]
- USD/JPY edges lower on Tuesday and snaps a three-day winning streak to the YTD peak.
The pair currently trades last at 146.455.
The previous day high was 146.75 while the previous day low was 146.27. The daily 38.2% Fib levels comes at 146.57, expected to provide resistance. Similarly, the daily 61.8% fib level is at 146.45, expected to provide support.
The USD/JPY pair meets with some supply during the Asian session on Tuesday and moves away from its highest level since November 2022, around the 146.75 region touched the previous day. Spot prices currently trade around the 146.30-146.35 area, down nearly 0.15% for the day, and for now, seems to have snapped a three-day winning streak, though any meaningful corrective decline still seems elusive.
The US Dollar (USD) remains depressed for the second successive day and extends its pullback from a nearly three-month high set on Friday amid a further decline in the US Treasury bond yields. Apart from this, speculations that Japanese authorities will intervene in the foreign exchange markets to prop up the domestic currency exert some downward pressure on the USD/JPY pair. That said, a big divergence in the monetary policy stance adopted by the Bank of Japan (BoJ) and other major central banks, including the Federal Reserve (Fed) should act as a tailwind for the major.
It is worth recalling that the BoJ is the only central bank in the world to maintain negative rates and is expected to stick to its ultra-easy monetary policy settings. The bets were reaffirmed by BoJ Governor Kazuo Ueda’s remarks at the Jackson Hole Symposium on Sunday, saying that the underlying inflation in Japan remains a bit below the 2% target. In contrast, Fed Chair Jerome Powell cemented expectations for one more 25 bps lift-off by the end of this year and said on Friday that the US central bank may need to raise interest rates further to cool still-too-high inflation.
Growing acceptance that the Fed will keep interest rates higher for longer should limit the downside for the US bond yields and support prospects for the emergence of some dip-buying around the USD. This makes it prudent to wait for strong follow-through selling before confirming that the USD/JPY pair has topped out in the near term and positioning for a further depreciating move. Traders now look to the US economic docket, featuring the release of the Conference Board’s Consumer Confidence Index and JOLTS Job Openings data later during the early North American session.
Apart from this, the US bond yields will influence the USD price dynamics, which, along with the broader risk sentiment, which tends to drive demand for the safe-haven JPY, should contribute to producing short-term trading opportunities around the USD/JPY pair. The focus, however, will remain on this week’s other important US macro data scheduled at the beginning of a new month, including the closely-watched monthly employment details – popularly known as the NFP report on Friday.
Technical Levels: Supports and Resistances
USDJPY currently trading at 146.42 at the time of writing. Pair opened at 146.54 and is trading with a change of -0.08 % .
| Overview | Overview.1 | |
|---|---|---|
| 0 | Today last price | 146.42 |
| 1 | Today Daily Change | -0.12 |
| 2 | Today Daily Change % | -0.08 |
| 3 | Today daily open | 146.54 |
The pair remains strongly bullish on the daily timeframe. It trades above its 20 SMA @ 144.74, 50 SMA 142.96, 100 SMA @ 140.01 and 200 SMA @ 136.7.
| Trends | Trends.1 | |
|---|---|---|
| 0 | Daily SMA20 | 144.74 |
| 1 | Daily SMA50 | 142.96 |
| 2 | Daily SMA100 | 140.01 |
| 3 | Daily SMA200 | 136.70 |
The previous day high was 146.75 while the previous day low was 146.27. The daily 38.2% Fib levels comes at 146.57, expected to provide resistance. Similarly, the daily 61.8% fib level is at 146.45, expected to provide support.
Note the levels of interest below:
- Pivot support is noted at 146.29, 146.05, 145.82
- Pivot resistance is noted at 146.76, 146.99, 147.24
| Levels | Levels.1 |
|---|---|
| Previous Daily High | 146.75 |
| Previous Daily Low | 146.27 |
| Previous Weekly High | 146.64 |
| Previous Weekly Low | 144.54 |
| Previous Monthly High | 144.91 |
| Previous Monthly Low | 137.24 |
| Daily Fibonacci 38.2% | 146.57 |
| Daily Fibonacci 61.8% | 146.45 |
| Daily Pivot Point S1 | 146.29 |
| Daily Pivot Point S2 | 146.05 |
| Daily Pivot Point S3 | 145.82 |
| Daily Pivot Point R1 | 146.76 |
| Daily Pivot Point R2 | 146.99 |
| Daily Pivot Point R3 | 147.24 |
[/s2If]
Download Nehcap EAWe have two EAs that are operational on our LIVE accounts.
- EA-FIX: Check out the details here. Download EA-FIX . EA-FIX is a non-grid HFT scalper.
- EA-GROWTH: High quality low dd EA using trend grids. Download EA_GROWTHJoin Our Telegram Group
")


