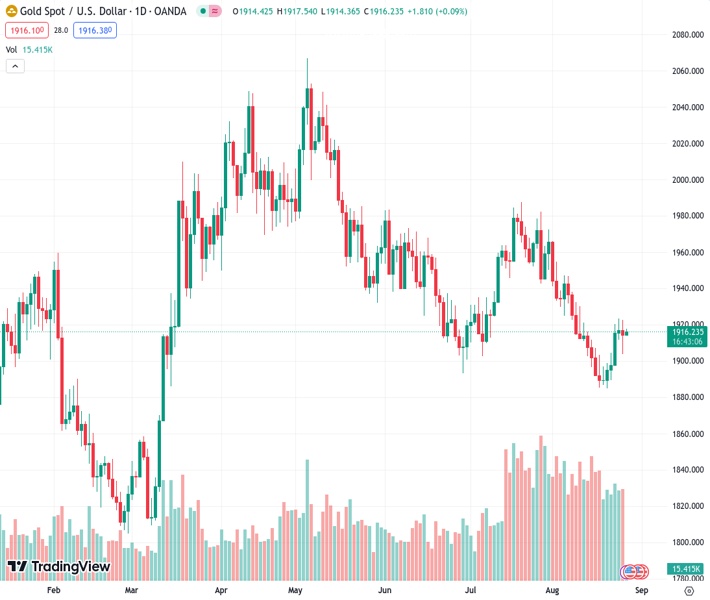
There is a slight increase in interest from buyers for gold as its price reaches 1,916.09 during the Asian trading session, but there is not much continuation in this trend.
…
This is a premium post.
[s2If !current_user_can(access_s2member_level4)]Please register for FREE REGISTER to read full post below containing analysis. In case of any error or you think you are not able to read the full post below, please email us at support#nehcap.com [lwa][/s2If] [s2If current_user_can(access_s2member_level1)]
- Gold price attracts some buyers during the Asian session, albeit lacks follow-through.
The pair currently trades last at 1916.09.
The previous day high was 1922.47 while the previous day low was 1903.84. The daily 38.2% Fib levels comes at 1910.96, expected to provide support. Similarly, the daily 61.8% fib level is at 1915.35, expected to provide support.
Gold price builds on Friday’s late rebound from the $1,904-$1,903 area and edges higher during the Asian session on the first day of a new week, though lacks bullish conviction. The XAU/USD currently trades around the $1,916 region, up less than 0.10% for the day, and remains below a two-week high touched last Thursday.
The US Dollar (USD) kicks off the new week on a softer note and moves away from its highest level since early June, which, in turn, is seen as a key factor benefitting the Gold price. A softer Greenback tends to benefit the US Dollar-denominated commodities, including the XAU/USD. That said, the prospects for further policy tightening by the Federal Reserve (Fed) hold back traders from placing aggressive bullish bets around the non-yielding Gold price and keep a lid on any further gains, at least for the time being.
In a keynote address at the Jackson Hole Symposium, Fed Chair Jerome Powell said on Friday that the US central bank may need to raise interest rates further to cool still-too-high inflation. He added that policymakers would proceed carefully as they decide whether to tighten further or to hold the interest rate constant. This reaffirms market bets for one more 25 basis point (bps) lift-off by the end of this year, which remains supportive of elevated US Treasury bond yields and continues to lend support to the USD.
Apart from this, the risk-on impulse, triggered by new measures announced by China over the weekend, might further contribute to capping the safe-haven Gold price. It is worth recalling that China on Sunday announced a reduction in the stamp duty on stock trading to boost the struggling market and revive investor confidence. The finance ministry said in a brief statement that the levy charged on stock trades will drop from 0.1% to 0.05% as of August 28, the first reduction since 2008. This remains supportive of a generally positive tone around the equity markets and might hold back bulls from placing fresh bets around the XAU/USD.
Moving ahead, there isn’t any relevant market-moving economic data due for release from the US on Monday, leaving the Gold price act at the mercy of the USD price dynamics and the broader risk sentiment. Any meaningful move in either direction, meanwhile, is more likely to be limited ahead of this week’s important US macro releases, including the closely-watched Non-Farm Payrolls (NFP) report on Friday. This makes it prudent to wait for strong follow-through buying before positioning for an extension of the recent goodish recovery from the $1,885 area, or the lowest level since March 13 touched last week.
Technical Levels: Supports and Resistances
XAUUSD currently trading at 1916.34 at the time of writing. Pair opened at 1915.34 and is trading with a change of 0.05 % .
| Overview | Overview.1 | |
|---|---|---|
| 0 | Today last price | 1916.34 |
| 1 | Today Daily Change | 1.00 |
| 2 | Today Daily Change % | 0.05 |
| 3 | Today daily open | 1915.34 |
The pair is trading below its 20 Daily moving average @ 1917.15, below its 50 Daily moving average @ 1930.74 , below its 100 Daily moving average @ 1958.04 and above its 200 Daily moving average @ 1910.15
| Trends | Trends.1 | |
|---|---|---|
| 0 | Daily SMA20 | 1917.15 |
| 1 | Daily SMA50 | 1930.74 |
| 2 | Daily SMA100 | 1958.04 |
| 3 | Daily SMA200 | 1910.15 |
The previous day high was 1922.47 while the previous day low was 1903.84. The daily 38.2% Fib levels comes at 1910.96, expected to provide support. Similarly, the daily 61.8% fib level is at 1915.35, expected to provide support.
Note the levels of interest below:
- Pivot support is noted at 1905.3, 1895.25, 1886.67
- Pivot resistance is noted at 1923.93, 1932.51, 1942.56
| Levels | Levels.1 |
|---|---|
| Previous Daily High | 1922.47 |
| Previous Daily Low | 1903.84 |
| Previous Weekly High | 1923.43 |
| Previous Weekly Low | 1884.85 |
| Previous Monthly High | 1987.54 |
| Previous Monthly Low | 1902.77 |
| Daily Fibonacci 38.2% | 1910.96 |
| Daily Fibonacci 61.8% | 1915.35 |
| Daily Pivot Point S1 | 1905.30 |
| Daily Pivot Point S2 | 1895.25 |
| Daily Pivot Point S3 | 1886.67 |
| Daily Pivot Point R1 | 1923.93 |
| Daily Pivot Point R2 | 1932.51 |
| Daily Pivot Point R3 | 1942.56 |
[/s2If]
Download Nehcap EAWe have two EAs that are operational on our LIVE accounts.
- EA-FIX: Check out the details here. Download EA-FIX . EA-FIX is a non-grid HFT scalper.
- EA-GROWTH: High quality low dd EA using trend grids. Download EA_GROWTHJoin Our Telegram Group
")


