The silver price at $24.300 is experiencing small increases after recording the largest weekly gain in six weeks. The outlook from @nehcap indicates anticipation for more upward movement.
…
This is a premium post.
[s2If !current_user_can(access_s2member_level4)]Please register for FREE REGISTER to read full post below containing analysis. In case of any error or you think you are not able to read the full post below, please email us at support#nehcap.com [lwa][/s2If] [s2If current_user_can(access_s2member_level1)]
- Silver Price prints mild gains after posting the biggest weekly gain in six.
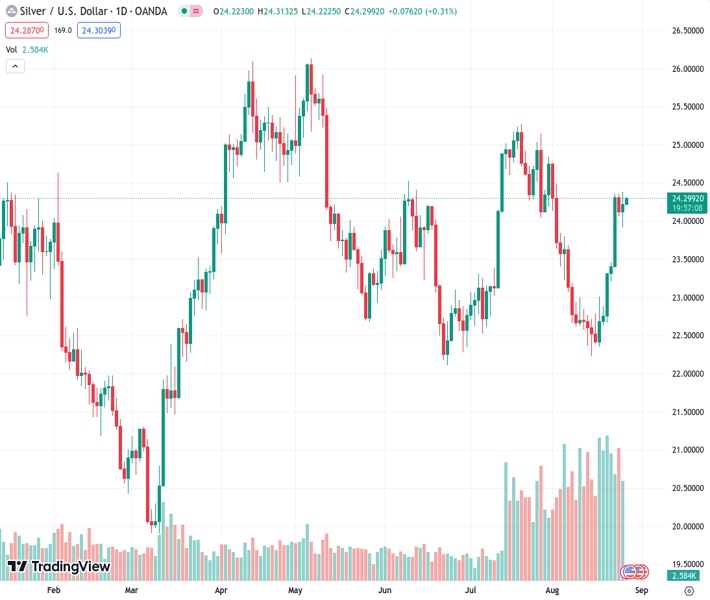
The pair currently trades last at 24.300.
The previous day high was 24.38 while the previous day low was 23.92. The daily 38.2% Fib levels comes at 24.21, expected to provide support. Similarly, the daily 61.8% fib level is at 24.1, expected to provide support.
Silver Price (XAG/USD) picks up bids to $24.30 as it defends the previous day’s rebound from the 100-DMA amid the early hours of Monday’s Asian trading session.
In addition to the XAG/USD’s U-turn from the 100-DMA, the bullish MACD signals and firmer RSI (14), not overbought, also underpin bullish bias about the bright metal.
However, a horizontal area comprising multiple levels marked since January 2023, close to $24.50, appears a tough nut to crack for the Silver buyers.
Following that, a downward-sloping resistance line from early May, around $24.85 by the press time, may act as the final defense of the XAG/USD sellers before enabling the commodity buyers to challenge the yearly high of $26.13.
On the flip side, a daily closing beneath the 100-DMA level of $23.97 isn’t an open invitation to the Silver sellers as the 50% Fibonacci retracement of the XAG/USD upside from March to May, around $23.00, and an ascending trend line from mid-March near $22.50, will challenge the bullion’s further downside.
Also acting as the downside filter is the 61.8% Fibonacci retracement level, also known as the “Golden Fibonacci Ratio”, surrounding $22.30.
Overall, the Silver price remains on the buyer’s radar even if the upside road remains long and bumpy.
Trend: Further upside expected
Technical Levels: Supports and Resistances
XAGUSD currently trading at 24.28 at the time of writing. Pair opened at 24.24 and is trading with a change of 0.17% % .
| Overview | Overview.1 | |
|---|---|---|
| 0 | Today last price | 24.28 |
| 1 | Today Daily Change | 0.04 |
| 2 | Today Daily Change % | 0.17% |
| 3 | Today daily open | 24.24 |
The pair remains strongly bullish on the daily timeframe. It trades above its 20 SMA @ 23.32, 50 SMA 23.53, 100 SMA @ 23.98 and 200 SMA @ 23.35.
| Trends | Trends.1 | |
|---|---|---|
| 0 | Daily SMA20 | 23.32 |
| 1 | Daily SMA50 | 23.53 |
| 2 | Daily SMA100 | 23.98 |
| 3 | Daily SMA200 | 23.35 |
The previous day high was 24.38 while the previous day low was 23.92. The daily 38.2% Fib levels comes at 24.21, expected to provide support. Similarly, the daily 61.8% fib level is at 24.1, expected to provide support.
Note the levels of interest below:
- Pivot support is noted at 23.98, 23.72, 23.51
- Pivot resistance is noted at 24.45, 24.65, 24.91
| Levels | Levels.1 |
|---|---|
| Previous Daily High | 24.38 |
| Previous Daily Low | 23.92 |
| Previous Weekly High | 24.38 |
| Previous Weekly Low | 22.67 |
| Previous Monthly High | 25.27 |
| Previous Monthly Low | 22.52 |
| Daily Fibonacci 38.2% | 24.21 |
| Daily Fibonacci 61.8% | 24.10 |
| Daily Pivot Point S1 | 23.98 |
| Daily Pivot Point S2 | 23.72 |
| Daily Pivot Point S3 | 23.51 |
| Daily Pivot Point R1 | 24.45 |
| Daily Pivot Point R2 | 24.65 |
| Daily Pivot Point R3 | 24.91 |
[/s2If]
Download Nehcap EAWe have two EAs that are operational on our LIVE accounts.
- EA-FIX: Check out the details here. Download EA-FIX . EA-FIX is a non-grid HFT scalper.
- EA-GROWTH: High quality low dd EA using trend grids. Download EA_GROWTHJoin Our Telegram Group
")


