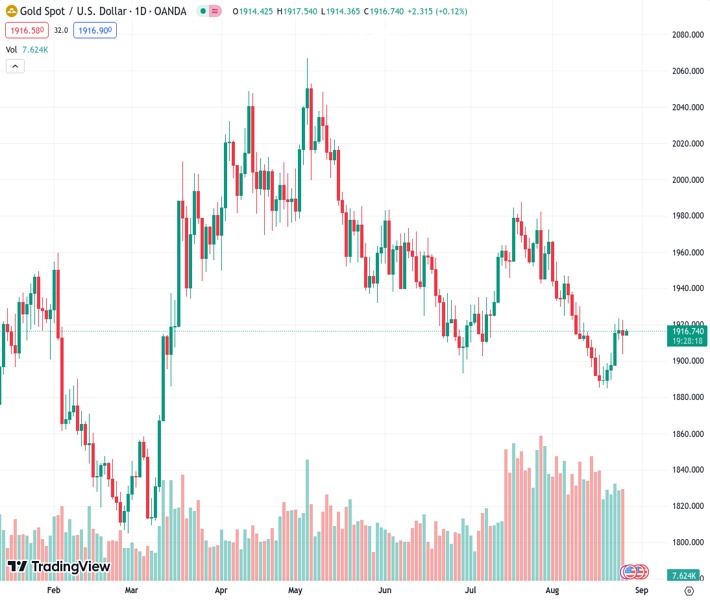
The price of gold, represented by #XAUUSD at $1,917.30, has increased to around $1,915 as a result of the decrease in US Treasury yields.
…
This is a premium post.
[s2If !current_user_can(access_s2member_level4)]Please register for FREE REGISTER to read full post below containing analysis. In case of any error or you think you are not able to read the full post below, please email us at support#nehcap.com [lwa][/s2If] [s2If current_user_can(access_s2member_level1)]
- Gold price trades higher around $1,915 on the back of US Treasury yields’ pullback.
The pair currently trades last at 1917.30.
The previous day high was 1922.47 while the previous day low was 1903.84. The daily 38.2% Fib levels comes at 1910.96, expected to provide support. Similarly, the daily 61.8% fib level is at 1915.35, expected to provide support.
Gold price trades near $1,915 per troy ounce during the Asian session on Monday, extending the previous week’s gains. The recent pullback in United States (US) Treasury yields has contributed to the rebound in the price of yellow metal. Additionally, moderate US economic data released during the previous week along with the mixed statements from the major central bank officials at the Jackson Hole Symposium, underpin the price of the Gold.
As said, US Durable Goods Orders for July posted a reduction of 5.2% as compared to the market consensus of 4%, swinging from the 4.4% reading in June. However, Initial Jobless Claims indicated favorable employment conditions, raising fears over the US inflation scenario. For the week ending on August 18, the index fell to 230K from the previous reading of 240K, which was expected to remain consistent.
Market participants are expected to adopt a cautious stance towards China’s economic concerns. According to data released by the National Bureau of Statistics on Sunday, China’s Total Industrial Profits (YoY) reported a decline of 15.5% during the first seven months of 2023. The attention of Gold traders is directed towards the four-day visit of US Commerce Secretary Gina Raimondo to Beijing starting on Sunday. The purpose of this visit is to enhance business ties between the two countries. It’s worth noting that the relationship between these two global superpowers is currently at an extremely low point. Investors will also likely monitor China’s services and manufacturing PMIs later in the week for further indication of the country’s economic conditions.
The US Dollar Index (DXY), which measures the performance of the Greenback against the six major currencies, trades lower around 104.10 despite the hawkish US Federal Reserve (Fed) remarks in the last week, prompting a cautious market sentiment as investors look for additional cues regarding the monetary policy outlook.
Fed Chairman Jerome Powell restated his support for maintaining “higher for longer” interest rates. He acknowledged that this policy approach has a constraining effect, yet emphasized that the Fed cannot definitively determine the exact level of the neutral rate. Powell also pointed out that there remains a significant amount of progress required to achieve price stability. In light of economic uncertainty, he highlighted the need for adaptable and nimble decision-making in monetary policy.
Technical Levels: Supports and Resistances
XAUUSD currently trading at 1915.62 at the time of writing. Pair opened at 1915.34 and is trading with a change of 0.01 % .
| Overview | Overview.1 | |
|---|---|---|
| 0 | Today last price | 1915.62 |
| 1 | Today Daily Change | 0.28 |
| 2 | Today Daily Change % | 0.01 |
| 3 | Today daily open | 1915.34 |
The pair is trading below its 20 Daily moving average @ 1917.15, below its 50 Daily moving average @ 1930.74 , below its 100 Daily moving average @ 1958.04 and above its 200 Daily moving average @ 1910.15
| Trends | Trends.1 | |
|---|---|---|
| 0 | Daily SMA20 | 1917.15 |
| 1 | Daily SMA50 | 1930.74 |
| 2 | Daily SMA100 | 1958.04 |
| 3 | Daily SMA200 | 1910.15 |
The previous day high was 1922.47 while the previous day low was 1903.84. The daily 38.2% Fib levels comes at 1910.96, expected to provide support. Similarly, the daily 61.8% fib level is at 1915.35, expected to provide support.
Note the levels of interest below:
- Pivot support is noted at 1905.3, 1895.25, 1886.67
- Pivot resistance is noted at 1923.93, 1932.51, 1942.56
| Levels | Levels.1 |
|---|---|
| Previous Daily High | 1922.47 |
| Previous Daily Low | 1903.84 |
| Previous Weekly High | 1923.43 |
| Previous Weekly Low | 1884.85 |
| Previous Monthly High | 1987.54 |
| Previous Monthly Low | 1902.77 |
| Daily Fibonacci 38.2% | 1910.96 |
| Daily Fibonacci 61.8% | 1915.35 |
| Daily Pivot Point S1 | 1905.30 |
| Daily Pivot Point S2 | 1895.25 |
| Daily Pivot Point S3 | 1886.67 |
| Daily Pivot Point R1 | 1923.93 |
| Daily Pivot Point R2 | 1932.51 |
| Daily Pivot Point R3 | 1942.56 |
[/s2If]
Download Nehcap EAWe have two EAs that are operational on our LIVE accounts.
- EA-FIX: Check out the details here. Download EA-FIX . EA-FIX is a non-grid HFT scalper.
- EA-GROWTH: High quality low dd EA using trend grids. Download EA_GROWTHJoin Our Telegram Group
")


