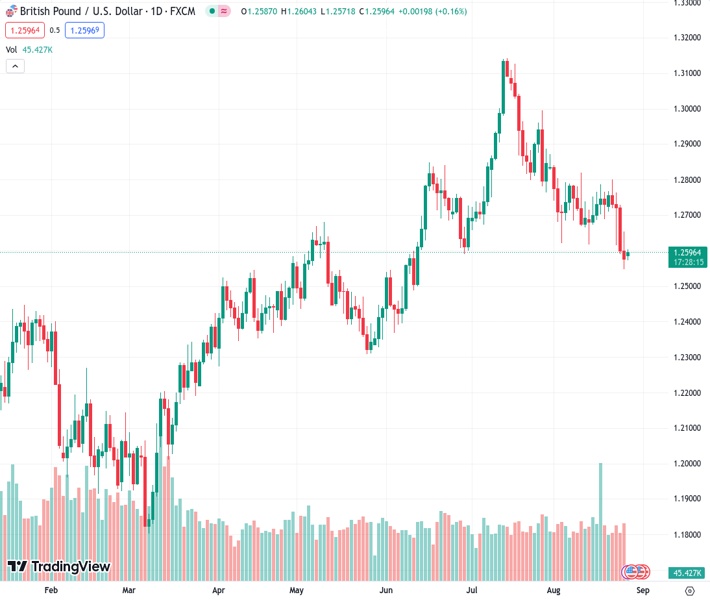
The GBP/USD pair at a rate of 1.25967 sees some buyers showing interest on Monday, benefiting from a slight decrease in the value of the US dollar and receiving support.
…
This is a premium post.
[s2If !current_user_can(access_s2member_level4)]Please register for FREE REGISTER to read full post below containing analysis. In case of any error or you think you are not able to read the full post below, please email us at support#nehcap.com [lwa][/s2If] [s2If current_user_can(access_s2member_level1)]
- GBP/USD attracts some buying on Monday and draws support from a modest USD downtick.
The pair currently trades last at 1.25967.
The previous day high was 1.2655 while the previous day low was 1.2548. The daily 38.2% Fib levels comes at 1.2589, expected to provide support. Similarly, the daily 61.8% fib level is at 1.2614, expected to provide resistance.
The GBP/USD pair gains some positive traction on the first day of a new week and moves away from its lowest level since June 13, around the 1.2550-1.2545 region touched on Friday. Spot prices retake the 1.2600 round-figure mark during the Asian session and draw support from a modest US Dollar (USD) downfall.
China on Sunday announced that the levy charged on stock trading will drop from 0.1% to 0.05% from August 28 – marking the first reduction since 2008 – to boost the struggling market. This, in turn, helps revive investor confidence, which is evident from a generally positive tone around the equity markets and leads to some profit-taking around the safe-haven Greenback, especially after the recent rally to a nearly three-month high. This, along with hawkish remarks by Bank of England (BoE) Deputy Governor Ben Broadbent, underpins the British Pound and provides a modest lift to the GBP/USD pair.
Speaking at the annual Jackson Hole Economic Symposium, Broadbent said on Saturday that monetary policy may well have to remain in restrictive territory for some time yet as the knock-on effects of the surge in prices were unlikely to fade away rapidly. Market participants, however, seem convinced that the BoE will not need to raise rates as high as previously thought to bring inflation back down to the target in the wake of growing recession fears. In fact, money markets are now pricing in a small chance of any further rate hike after the widely anticipated 25 bps lift-off at the September meeting.
Furthermore, Federal Reserve (Fed) Chair Jerome Powell pretty much cemented market expectations for one more rate hike by the end of this year. In fact, Powell said on Friday that the Fed may need to raise interest rates further to cool still-high inflation and added that policymakers would proceed carefully as they decide whether to tighten further or to hold the policy rate constant. This remains supportive of elevated US Treasury bond yields, which, along with worries about a global economic downturn, might help limit any meaningful downside for the USD and cap any further gains for the GBP/USD pair.
Moving ahead, there isn’t any relevant market-moving economic data due for release on Monday and the UK banks will remain closed in observance of the Summer Bank Holiday. Foreover, last week’s sustained breakdown through the 100-day Simple Moving Average (SMA) suggests that the path of least resistance for the GBP/USD pair is to the downside. This further makes it prudent to wait for strong follow-through buying before confirming that the recent downward trajectory witnessed over the past six weeks or so has run its course and positioning for any meaningful appreciating move, at least for the time being.
Technical Levels: Supports and Resistances
GBPUSD currently trading at 1.2599 at the time of writing. Pair opened at 1.258 and is trading with a change of 0.15 % .
| Overview | Overview.1 | |
|---|---|---|
| 0 | Today last price | 1.2599 |
| 1 | Today Daily Change | 0.0019 |
| 2 | Today Daily Change % | 0.1500 |
| 3 | Today daily open | 1.2580 |
The pair is trading below its 20 Daily moving average @ 1.272, below its 50 Daily moving average @ 1.2788 , below its 100 Daily moving average @ 1.264 and above its 200 Daily moving average @ 1.24
| Trends | Trends.1 | |
|---|---|---|
| 0 | Daily SMA20 | 1.2720 |
| 1 | Daily SMA50 | 1.2788 |
| 2 | Daily SMA100 | 1.2640 |
| 3 | Daily SMA200 | 1.2400 |
The previous day high was 1.2655 while the previous day low was 1.2548. The daily 38.2% Fib levels comes at 1.2589, expected to provide support. Similarly, the daily 61.8% fib level is at 1.2614, expected to provide resistance.
Note the levels of interest below:
- Pivot support is noted at 1.2534, 1.2488, 1.2427
- Pivot resistance is noted at 1.2641, 1.2701, 1.2747
| Levels | Levels.1 |
|---|---|
| Previous Daily High | 1.2655 |
| Previous Daily Low | 1.2548 |
| Previous Weekly High | 1.2800 |
| Previous Weekly Low | 1.2548 |
| Previous Monthly High | 1.3142 |
| Previous Monthly Low | 1.2659 |
| Daily Fibonacci 38.2% | 1.2589 |
| Daily Fibonacci 61.8% | 1.2614 |
| Daily Pivot Point S1 | 1.2534 |
| Daily Pivot Point S2 | 1.2488 |
| Daily Pivot Point S3 | 1.2427 |
| Daily Pivot Point R1 | 1.2641 |
| Daily Pivot Point R2 | 1.2701 |
| Daily Pivot Point R3 | 1.2747 |
[/s2If]
Download Nehcap EAWe have two EAs that are operational on our LIVE accounts.
- EA-FIX: Check out the details here. Download EA-FIX . EA-FIX is a non-grid HFT scalper.
- EA-GROWTH: High quality low dd EA using trend grids. Download EA_GROWTHJoin Our Telegram Group
")


