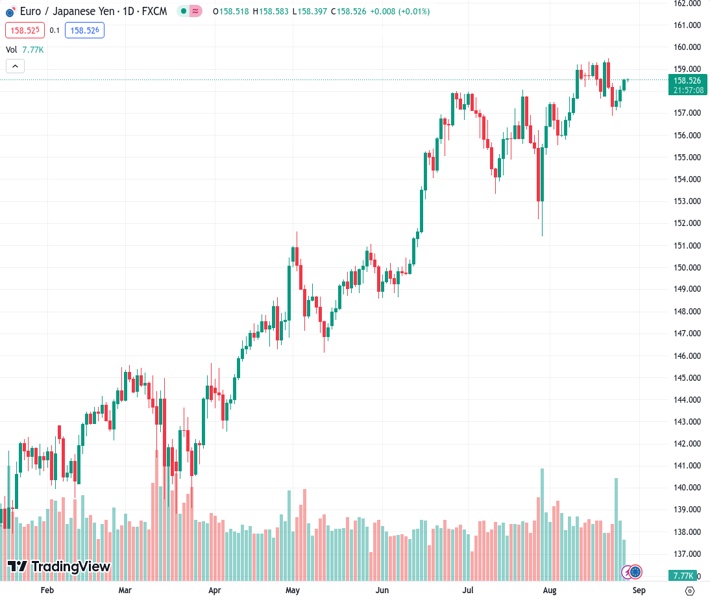
The EURJPY pair is currently trading at 158.47, slightly lower than its initial rate of 158.537. Its movement suggests a neutral to downward trend as it remains close to the Tenkan-Sen line at 158.18. Notably, there are important levels of support and resistance that could influence future price movements.
…
This is a premium post.
[s2If !current_user_can(access_s2member_level4)]Please register for FREE REGISTER to read full post below containing analysis. In case of any error or you think you are not able to read the full post below, please email us at support#nehcap.com [lwa][/s2If] [s2If current_user_can(access_s2member_level1)]
- EUR/JPY trades at 158.47, showing a neutral to downside bias as it hovers near the Tenkan-Sen line at 158.18, with key support and resistance levels in sight.
The pair currently trades last at 158.537.
The previous day high was 158.25 while the previous day low was 157.23. The daily 38.2% Fib levels comes at 157.86, expected to provide support. Similarly, the daily 61.8% fib level is at 157.62, expected to provide support.
As the Asian session begins, the EUR/JPY registers minuscule losses after posting 0.31% of gains on Monday due to an improvement in risk appetite that dragged the pair from around daily lows of 157.97 to its high of 158.56. At the time of writing, the cross-currency pair trades at 158.47, down 0.03%.
The EUR/JPY daily chart portrays the pair as neutral-biased, though slightly tilted to the downside, as it achieved a daily low below the August 18 swing low of 157.65. Nevertheless, the recent leg up could pave the way for retesting year-to-date (YTD) highs of 159.21 unless the EUR/JPY drops below the Tenkan-Sen line at 158.18, followed by the 158.00 mark. Once achieved, the next stop would be the August 23 daily low of 156.87, followed by the top of the Ichimoku Cloud (Kumo) at 155.96.
From an intraday perspective, the cross-currency pair appears to have peaked as EUR/JPY price action loses steam, with the pair failing to achieve a higher high that tests the 159.00 mark. If the EUR/JPY drops below the Tenkan Sen at 158.38, that could exacerbate further losses. The next support would be the Kijun-Sen at 158.28, followed by the S1 daily pivot at 158.14, and then the S2 pivot at 157.75.
Conversely, if EUR/JPY Climbs towards the R1 pivot at 158.74, a test of the YTD high at 159.49 is on the cards.
Technical Levels: Supports and Resistances
EURJPY currently trading at 158.5 at the time of writing. Pair opened at 158.1 and is trading with a change of 0.25 % .
| Overview | Overview.1 | |
|---|---|---|
| 0 | Today last price | 158.50 |
| 1 | Today Daily Change | 0.40 |
| 2 | Today Daily Change % | 0.25 |
| 3 | Today daily open | 158.10 |
The pair remains strongly bullish on the daily timeframe. It trades above its 20 SMA @ 157.82, 50 SMA 156.8, 100 SMA @ 152.85 and 200 SMA @ 147.68.
| Trends | Trends.1 | |
|---|---|---|
| 0 | Daily SMA20 | 157.82 |
| 1 | Daily SMA50 | 156.80 |
| 2 | Daily SMA100 | 152.85 |
| 3 | Daily SMA200 | 147.68 |
The previous day high was 158.25 while the previous day low was 157.23. The daily 38.2% Fib levels comes at 157.86, expected to provide support. Similarly, the daily 61.8% fib level is at 157.62, expected to provide support.
Note the levels of interest below:
- Pivot support is noted at 157.47, 156.84, 156.46
- Pivot resistance is noted at 158.48, 158.87, 159.5
| Levels | Levels.1 |
|---|---|
| Previous Daily High | 158.25 |
| Previous Daily Low | 157.23 |
| Previous Weekly High | 159.49 |
| Previous Weekly Low | 156.87 |
| Previous Monthly High | 158.05 |
| Previous Monthly Low | 151.41 |
| Daily Fibonacci 38.2% | 157.86 |
| Daily Fibonacci 61.8% | 157.62 |
| Daily Pivot Point S1 | 157.47 |
| Daily Pivot Point S2 | 156.84 |
| Daily Pivot Point S3 | 156.46 |
| Daily Pivot Point R1 | 158.48 |
| Daily Pivot Point R2 | 158.87 |
| Daily Pivot Point R3 | 159.50 |
[/s2If]
Download Nehcap EAWe have two EAs that are operational on our LIVE accounts.
- EA-FIX: Check out the details here. Download EA-FIX . EA-FIX is a non-grid HFT scalper.
- EA-GROWTH: High quality low dd EA using trend grids. Download EA_GROWTHJoin Our Telegram Group
")


