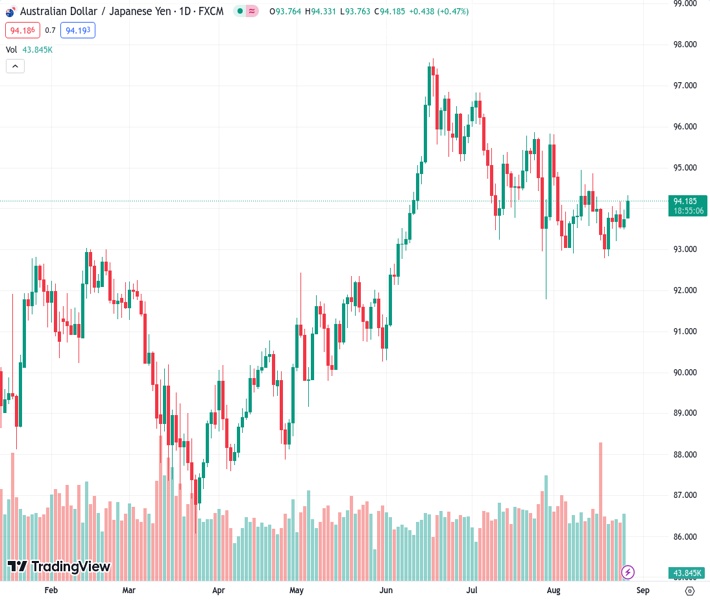
The AUDJPY pair at 94.1700 is experiencing a slight increase for the second consecutive day and rises to its highest level in almost two weeks.
…
This is a premium post.
[s2If !current_user_can(access_s2member_level4)]Please register for FREE REGISTER to read full post below containing analysis. In case of any error or you think you are not able to read the full post below, please email us at support#nehcap.com [lwa][/s2If] [s2If current_user_can(access_s2member_level1)]
- AUD/JPY gains some traction for the second straight day and climbs to a nearly two-week top.
The pair currently trades last at 94.1700.
The previous day high was 93.98 while the previous day low was 93.5. The daily 38.2% Fib levels comes at 93.79, expected to provide support. Similarly, the daily 61.8% fib level is at 93.68, expected to provide support.
The AUD/JPY cross scales higher for the second successive day on Monday and touches a nearly two-week high, around the 94.30-94.35 region during the Asian session. Spot prices, meanwhile, stick to intraday gains and react little to the better-than-expected Australian macro data.
In fact, the Australian Bureau of Statistics (ABS) reported that Retail Sales – a measure of the country’s consumer spending – rose 0.5% in July against market expectations for a 0.3% increase and the 0.8% decline registered in the previous month. The backwards-looking data does little to provide any meaningful impetus, though new measures announced by China continue to lend support to antipodean currencies, including the Australian Dollar (AUD). Apart from this, the offered tone surrounding the Japanese Yen (JPY) turns out to be another factor pushing the AUD/JPY cross higher.
It is worth recalling that China on Sunday announced a reduction in the stamp duty on stock trading to boost the struggling market and revive investor confidence. The finance ministry said in a brief statement that the levy charged on stock trades will drop from 0.1% to 0.05% as of August 28, marking the first reduction since 2008. This, in turn, triggers a risk-on rally, which, along with a more dovish stance adopted by the Bank of Japan (BoJ), is seen undermining the safe-haven Japanese Yen (JPY) and contributing to the strong intraday bid tone surrounding the AUD/JPY cross.
In fact, BoJ Governor Kazuo Ueda on Sunday, speaking at the Jackson Hole Symposium, said that the underlying inflation in Japan remains a bit below the 2% target and the central bank will stick to current ultra-easy monetary policy settings. This comes after data released on Friday showed that consumer prices in Tokyo – Japan’s capital city – grew at a slower-than-expected pace in August and pretty much ensured that the BoJ may keep the status quo until next summer. That said, concerns about the worsening economic conditions might cap gains for the AUD/JPY cross.
Apart from this, expectations for another on-hold rate decision by the Reserve Bank of Australia (RBA) in September warrants some caution before positioning for any further apprecaiting move. From a technical perspective, meanwhile, the recent bounce from the 100-day Simple Moving Average (SMA) and the subsequent move up favours bulls amid a big divergence in the policy stance adopted by the BoJ and other major central banks. Hence, some follow-through strength towards the next relevant hurdle, ahead of the 95.00 psychological mark, looks like a distinct possibility.
Technical Levels: Supports and Resistances
AUDJPY currently trading at 94.23 at the time of writing. Pair opened at 93.78 and is trading with a change of 0.48 % .
| Overview | Overview.1 | |
|---|---|---|
| 0 | Today last price | 94.23 |
| 1 | Today Daily Change | 0.45 |
| 2 | Today Daily Change % | 0.48 |
| 3 | Today daily open | 93.78 |
The pair is trading above its 20 Daily moving average @ 93.91, below its 50 Daily moving average @ 94.79 , above its 100 Daily moving average @ 93.07 and above its 200 Daily moving average @ 91.9
| Trends | Trends.1 | |
|---|---|---|
| 0 | Daily SMA20 | 93.91 |
| 1 | Daily SMA50 | 94.79 |
| 2 | Daily SMA100 | 93.07 |
| 3 | Daily SMA200 | 91.90 |
The previous day high was 93.98 while the previous day low was 93.5. The daily 38.2% Fib levels comes at 93.79, expected to provide support. Similarly, the daily 61.8% fib level is at 93.68, expected to provide support.
Note the levels of interest below:
- Pivot support is noted at 93.53, 93.27, 93.05
- Pivot resistance is noted at 94.01, 94.24, 94.49
| Levels | Levels.1 |
|---|---|
| Previous Daily High | 93.98 |
| Previous Daily Low | 93.50 |
| Previous Weekly High | 94.18 |
| Previous Weekly Low | 92.83 |
| Previous Monthly High | 96.84 |
| Previous Monthly Low | 91.79 |
| Daily Fibonacci 38.2% | 93.79 |
| Daily Fibonacci 61.8% | 93.68 |
| Daily Pivot Point S1 | 93.53 |
| Daily Pivot Point S2 | 93.27 |
| Daily Pivot Point S3 | 93.05 |
| Daily Pivot Point R1 | 94.01 |
| Daily Pivot Point R2 | 94.24 |
| Daily Pivot Point R3 | 94.49 |
[/s2If]
Download Nehcap EAWe have two EAs that are operational on our LIVE accounts.
- EA-FIX: Check out the details here. Download EA-FIX . EA-FIX is a non-grid HFT scalper.
- EA-GROWTH: High quality low dd EA using trend grids. Download EA_GROWTHJoin Our Telegram Group
")


