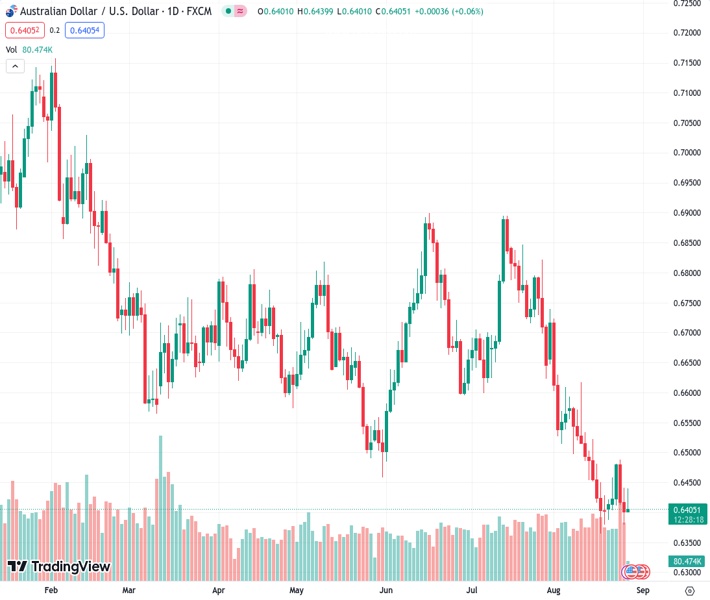
During Monday’s trading session, the AUDUSD currency pair at a price level of 0.64094 experienced a decrease in demand, leading to intraday sellers entering the market. As a result, the currency pair retraced towards the lowest price point of the day in the final hour of trading.
…
This is a premium post.
[s2If !current_user_can(access_s2member_level4)]Please register for FREE REGISTER to read full post below containing analysis. In case of any error or you think you are not able to read the full post below, please email us at support#nehcap.com [lwa][/s2If] [s2If current_user_can(access_s2member_level1)]
- AUD/USD attracts some intraday sellers on Monday and retreats to the daily low in the last hour.
The pair currently trades last at 0.64094.
The previous day high was 0.6442 while the previous day low was 0.638. The daily 38.2% Fib levels comes at 0.6403, expected to provide support. Similarly, the daily 61.8% fib level is at 0.6418, expected to provide resistance.
The AUD/USD pair struggles to preserve its modest intraday gains and retreats to the lower end of its daily range during the early part of the European session on Monday. Spot prices, however, manage to hold above the 0.6400 round figure, though the fundamental backdrop seems tilted in favour of bearish traders and support prospects for the resumption of a multi-week-old downtrend from the July swing high.
China rolled out new measures over the weekend to draw investors back into its battered stock markets, which, along with the better-than-expected domestic data, provided a modest lift to the Australian Dollar (AUD) on the first day of a new week. It is worth recalling that China’s finance ministry said in a brief statement on Sunday that the stamp duty levied on stock trading will drop from 0.1% to 0.05% as of August 28, marking the first reduction since 2008. Furthermore, the Australian Bureau of Statistics (ABS) reported that Retail Sales – a measure of the country’s consumer spending – rose 0.5% in July against consensus estimates for a 0.3% increase and a 0.8% decline in the previous month.
Apart from this, a positive tone around the equity markets drags the safe-haven US Dollar (USD) away from its highest level since early June touched on Friday and offers additional support to the AUD/USD pair. The corrective USD decline, however, remains limited in the wake of rising bets for further policy tightening by the Federal Reserve (Fed). In fact, the markets have been pricing in the possibility of one more 25 bps rate hike by the end of this year and the expectations were reaffirmed by Fed Chair Jerome Powell’s hawkish remarks on Friday. In a keynote address at the Jackson Hole Symposium on Friday, Powell said that the Fed may need to raise rates further to cool still-too-high inflation.
Furthermore, growing concerns about the worsening economic conditions in China and looming recession risks keep a lid on the optimism in the markets. Apart from this, expectations for another on-hold rate decision by the Reserve Bank of Australia (RBA) in September contribute to capping the AUD/USD pair and attracting fresh sellers at higher levels. This, in turn, suggests that the path of least resistance for spot prices is to the downside, though bears might still need to wait for acceptance below the 0.6400 mark before placing fresh bets in the absence of any relevant market-moving economic releases from the US.
Technical Levels: Supports and Resistances
AUDUSD currently trading at 0.6406 at the time of writing. Pair opened at 0.6404 and is trading with a change of 0.03 % .
| Overview | Overview.1 | |
|---|---|---|
| 0 | Today last price | 0.6406 |
| 1 | Today Daily Change | 0.0002 |
| 2 | Today Daily Change % | 0.0300 |
| 3 | Today daily open | 0.6404 |
The pair remains strongly bearish on the daily time frame. It trades below the 20 SMA @ 0.6498, 50 SMA 0.6637, 100 SMA @ 0.6655 and 200 SMA @ 0.6727.
| Trends | Trends.1 | |
|---|---|---|
| 0 | Daily SMA20 | 0.6498 |
| 1 | Daily SMA50 | 0.6637 |
| 2 | Daily SMA100 | 0.6655 |
| 3 | Daily SMA200 | 0.6727 |
The previous day high was 0.6442 while the previous day low was 0.638. The daily 38.2% Fib levels comes at 0.6403, expected to provide support. Similarly, the daily 61.8% fib level is at 0.6418, expected to provide resistance.
Note the levels of interest below:
- Pivot support is noted at 0.6376, 0.6347, 0.6314
- Pivot resistance is noted at 0.6437, 0.647, 0.6499
| Levels | Levels.1 |
|---|---|
| Previous Daily High | 0.6442 |
| Previous Daily Low | 0.6380 |
| Previous Weekly High | 0.6488 |
| Previous Weekly Low | 0.6380 |
| Previous Monthly High | 0.6895 |
| Previous Monthly Low | 0.6599 |
| Daily Fibonacci 38.2% | 0.6403 |
| Daily Fibonacci 61.8% | 0.6418 |
| Daily Pivot Point S1 | 0.6376 |
| Daily Pivot Point S2 | 0.6347 |
| Daily Pivot Point S3 | 0.6314 |
| Daily Pivot Point R1 | 0.6437 |
| Daily Pivot Point R2 | 0.6470 |
| Daily Pivot Point R3 | 0.6499 |
[/s2If]
Download Nehcap EAWe have two EAs that are operational on our LIVE accounts.
- EA-FIX: Check out the details here. Download EA-FIX . EA-FIX is a non-grid HFT scalper.
- EA-GROWTH: High quality low dd EA using trend grids. Download EA_GROWTHJoin Our Telegram Group
")


