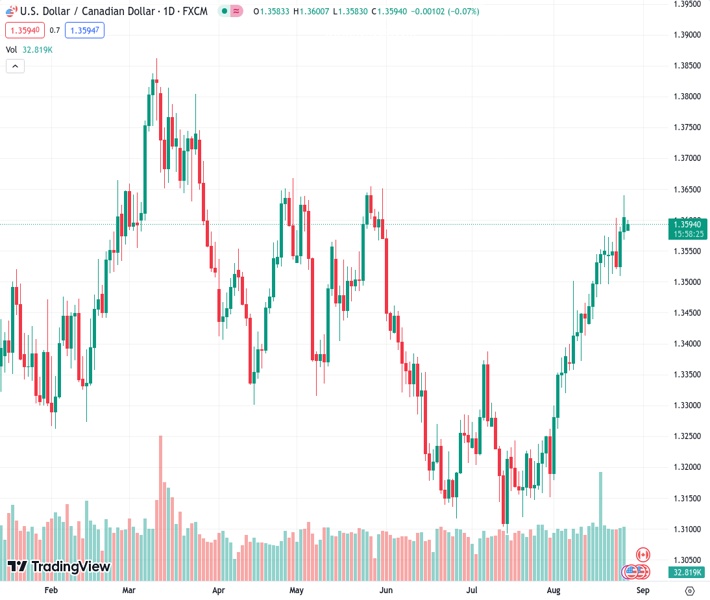
Bulls at the three-month high of USDCAD @ 1.35933 pause and continue their winning streak for the second consecutive day.
…
This is a premium post.
[s2If !current_user_can(access_s2member_level4)]Please register for FREE REGISTER to read full post below containing analysis. In case of any error or you think you are not able to read the full post below, please email us at support#nehcap.com [lwa][/s2If] [s2If current_user_can(access_s2member_level1)]
- USD/CAD bulls take a breather at three-month high, prods two-day winning streak.
The pair currently trades last at 1.35933.
The previous day high was 1.364 while the previous day low was 1.3569. The daily 38.2% Fib levels comes at 1.3613, expected to provide resistance. Similarly, the daily 61.8% fib level is at 1.3596, expected to provide resistance.
USD/CAD retreats from the highest level in three months despite lacking downside momentum around 1.3595-90 during the early Monday morning in Europe. In doing so, the Loonie pair cheers the US Dollar’s pullback while paying a little heed to the softer prices of Canada’s main export item, namely the WTI crude oil, amid a slightly optimistic market ahead of this week’s top-tier data/events from the US and Canada.
That said, the US Dollar Index (DXY) eases from the highest level since June 01 to around 104.05 while the WTI crude oil snaps the two-day winning streak around $79.65 by the press time.
Greenback bears the burden of the market’s cautious optimism after witnessing a hesitantly hawkish remarks from the global central banks as they defended their respective restrictive monetary policies. Among them, Fed Chair Jerome Powell gained major attention as he reiterated his defense of “higher for longer” rates while stating that the policy is restrictive but the Fed can’t be certain what neutral rate level is. The policymaker also added that there is substantial further ground to cover to get back to price stability while also stating that the economic uncertainty calls for agile monetary policy-making.
Elsewhere, the introduction of one more measure to boost China’s economic activity, via halving the current stamp duty of 0.1% on stock trading, also favors the sentiment and weighs on the US Dollar of late. On the same line could be the news from the Wall Street Journal (WSJ) which cites people familiar with the decision-making process in China to highlight Chinese Communist Party Chairman Xi Jinping’s deep-rooted philosophical objections to Western-style consumption-driven growth, suggesting more stimulus ahead.
It’s worth noting, however, that the Oil buyers need more to defend the previous gains amid mixed concerns about China, concerning the ongoing US-China trade talks and the talks of witnessing softer economic recovery in Beijing.
Against this backdrop, S&P 500 Futures defend the previous day’s rebound from a one-week low to around 4,420, up 0.10% intraday, whereas the US 10-year Treasury bond yields grind near 4.23% after snapping the four-week uptrend by posting minor weekly losses as it retreated from the highest level since 2007.
Moving on, a light calendar and preparations for this week’s top-tier data/events may allow the USD/CAD to remain pressured. However, major attention will be given to Canada’s growth numbers and the Federal Reserve’s (Fed) favorite inflation gauge, namely the Core Personal Consumption Expenditure (PCE) Price Index for July, as well as the monthly employment data for August, for clear directions.
USD/CAD pair’s successful trading above a three-week-old rising support line surrounding 1.3535 keeps the buyers hopeful of crossing the four-month-old descending resistance line, close to 1.3600 by the press time.
Technical Levels: Supports and Resistances
USDCAD currently trading at 1.3594 at the time of writing. Pair opened at 1.3601 and is trading with a change of -0.05% % .
| Overview | Overview.1 | |
|---|---|---|
| 0 | Today last price | 1.3594 |
| 1 | Today Daily Change | -0.0007 |
| 2 | Today Daily Change % | -0.05% |
| 3 | Today daily open | 1.3601 |
The pair remains strongly bullish on the daily timeframe. It trades above its 20 SMA @ 1.3452, 50 SMA 1.3309, 100 SMA @ 1.3389 and 200 SMA @ 1.3459.
| Trends | Trends.1 | |
|---|---|---|
| 0 | Daily SMA20 | 1.3452 |
| 1 | Daily SMA50 | 1.3309 |
| 2 | Daily SMA100 | 1.3389 |
| 3 | Daily SMA200 | 1.3459 |
The previous day high was 1.364 while the previous day low was 1.3569. The daily 38.2% Fib levels comes at 1.3613, expected to provide resistance. Similarly, the daily 61.8% fib level is at 1.3596, expected to provide resistance.
Note the levels of interest below:
- Pivot support is noted at 1.3567, 1.3533, 1.3496
- Pivot resistance is noted at 1.3638, 1.3674, 1.3709
| Levels | Levels.1 |
|---|---|
| Previous Daily High | 1.3640 |
| Previous Daily Low | 1.3569 |
| Previous Weekly High | 1.3640 |
| Previous Weekly Low | 1.3496 |
| Previous Monthly High | 1.3387 |
| Previous Monthly Low | 1.3093 |
| Daily Fibonacci 38.2% | 1.3613 |
| Daily Fibonacci 61.8% | 1.3596 |
| Daily Pivot Point S1 | 1.3567 |
| Daily Pivot Point S2 | 1.3533 |
| Daily Pivot Point S3 | 1.3496 |
| Daily Pivot Point R1 | 1.3638 |
| Daily Pivot Point R2 | 1.3674 |
| Daily Pivot Point R3 | 1.3709 |
[/s2If]
Download Nehcap EAWe have two EAs that are operational on our LIVE accounts.
- EA-FIX: Check out the details here. Download EA-FIX . EA-FIX is a non-grid HFT scalper.
- EA-GROWTH: High quality low dd EA using trend grids. Download EA_GROWTHJoin Our Telegram Group
")


