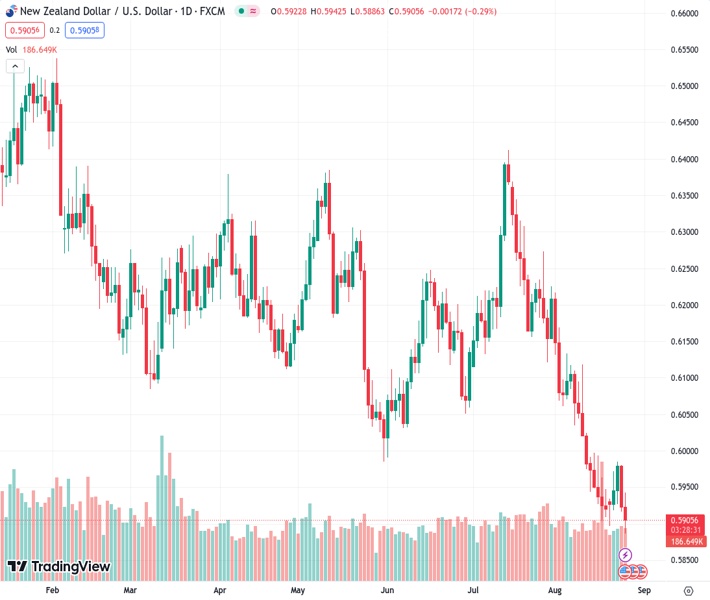
The NZDUSD currency pair declined to its lowest level since November 2022, dropping below 0.5900, before later recovering and settling above that level.
…
This is a premium post.
[s2If !current_user_can(access_s2member_level4)]Please register for FREE REGISTER to read full post below containing analysis. In case of any error or you think you are not able to read the full post below, please email us at support#nehcap.com [lwa][/s2If] [s2If current_user_can(access_s2member_level1)]
- NZD/USD fell to its lowest point since November 2022, below 0.5900 then settled back above.
The pair currently trades last at 0.59046.
The previous day high was 0.5982 while the previous day low was 0.5916. The daily 38.2% Fib levels comes at 0.5941, expected to provide resistance. Similarly, the daily 61.8% fib level is at 0.5957, expected to provide resistance.
In Friday’s session, the USD is one of the top performers, helped by a hawkish remark by the Federal Reserve (Fed) chairman at the Jackson Hole Symposium. On the other hand, New Zealand’s calendar had nothing relevant to offer. Eyes on potential Chinese government support to the real state sector of China.
After markets being cautious during the week, looking for clues regarding the next Fed’s moves, Chair Powell gave some clarity. He pointed out that the bank will retain its policy at restrictive levels until the economy shows signs of cooling down, accompanied by lower inflation. He then commented that the Fed will proceed carefully concerning the incoming data regarding the next decisions.
That being said, Thomas Barking and Loretta Mester also spoke. Barkin commented that the Fed will “clearly hold” through the end of the year, while Mester stated that the bank probably has some more work to do. In addition, the latter stated that she doesn’t see the Fed cutting in 2024.
As a reaction, according to the CME FedWatch, markets are buying the hawkish rhetoric, with the odds of a 25 basis point (bps) hike rising to nearly 44%. In line with that, the 2,5 and 10-year US Treasury yields rose to 5.07%, 4.46% and 4.23% respectively, boosting the USD.
On the Kiwi side, it faced selling pressure during the week due to the Chinese economic woes, as China is one of its biggest trading partners. That said, reports suggest that the Chinese government will take action to relieve the housing sector. Those measures aim to encourage homebuying by removing restrictions on first-time buyers and providing tax rebates. Still, their effectiveness is limited due to existing market challenges and investor scepticism, as reflected in the continued poor performance of China’s equities.
Analysing the daily chart, the NZD/USD technical outlook is bearish in the short term. The Relative Strength Index (RSI) is comfortably positioned below its midline in negative territory. It has a southward slope, indicating a strong selling momentum. It is further supported by the negative signal from the Moving Average Convergence Divergence (MACD), which displays red bars, underscoring the growing bearish momentum. Additionally, the pair is below the 20,100 and 200-day Simple Moving Averages (SMAs), highlighting the continued dominance of bears on the broader scale.
Support levels: 0.5885, 0.5850, 0.5830.
Resistance levels: 0.5940, 0.5970, 0.6000 (20-day SMA).
Technical Levels: Supports and Resistances
NZDUSD currently trading at 0.5909 at the time of writing. Pair opened at 0.5923 and is trading with a change of -0.24 % .
| Overview | Overview.1 | |
|---|---|---|
| 0 | Today last price | 0.5909 |
| 1 | Today Daily Change | -0.0014 |
| 2 | Today Daily Change % | -0.2400 |
| 3 | Today daily open | 0.5923 |
The pair remains strongly bearish on the daily time frame. It trades below the 20 SMA @ 0.6024, 50 SMA 0.6131, 100 SMA @ 0.6155 and 200 SMA @ 0.6228.
| Trends | Trends.1 | |
|---|---|---|
| 0 | Daily SMA20 | 0.6024 |
| 1 | Daily SMA50 | 0.6131 |
| 2 | Daily SMA100 | 0.6155 |
| 3 | Daily SMA200 | 0.6228 |
The previous day high was 0.5982 while the previous day low was 0.5916. The daily 38.2% Fib levels comes at 0.5941, expected to provide resistance. Similarly, the daily 61.8% fib level is at 0.5957, expected to provide resistance.
Note the levels of interest below:
- Pivot support is noted at 0.5899, 0.5874, 0.5833
- Pivot resistance is noted at 0.5965, 0.6006, 0.6031
| Levels | Levels.1 |
|---|---|
| Previous Daily High | 0.5982 |
| Previous Daily Low | 0.5916 |
| Previous Weekly High | 0.5997 |
| Previous Weekly Low | 0.5903 |
| Previous Monthly High | 0.6413 |
| Previous Monthly Low | 0.6120 |
| Daily Fibonacci 38.2% | 0.5941 |
| Daily Fibonacci 61.8% | 0.5957 |
| Daily Pivot Point S1 | 0.5899 |
| Daily Pivot Point S2 | 0.5874 |
| Daily Pivot Point S3 | 0.5833 |
| Daily Pivot Point R1 | 0.5965 |
| Daily Pivot Point R2 | 0.6006 |
| Daily Pivot Point R3 | 0.6031 |
[/s2If]
Download Nehcap EAWe have two EAs that are operational on our LIVE accounts.
- EA-FIX: Check out the details here. Download EA-FIX . EA-FIX is a non-grid HFT scalper.
- EA-GROWTH: High quality low dd EA using trend grids. Download EA_GROWTHJoin Our Telegram Group
")


