Jerome Powell’s remarks during the #XAUUSD trading at 1,912.81 suggested that he was careful with a slightly hawkish stance, keeping the possibility of another interest rate increase in 2023.
…
This is a premium post.
[s2If !current_user_can(access_s2member_level4)]Please register for FREE REGISTER to read full post below containing analysis. In case of any error or you think you are not able to read the full post below, please email us at support#nehcap.com [lwa][/s2If] [s2If current_user_can(access_s2member_level1)]
- Jerome Powell sounded cautious with a hawkish tilt, leaving the door open for another hike in 2023.
The pair currently trades last at 1912.81.
The previous day high was 1923.43 while the previous day low was 1911.83. The daily 38.2% Fib levels comes at 1919.0, expected to provide resistance. Similarly, the daily 61.8% fib level is at 1916.26, expected to provide resistance.
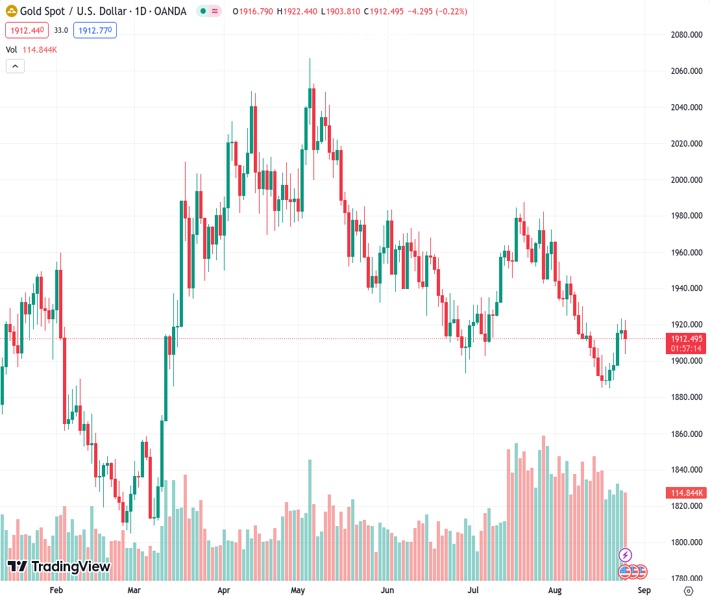
On Friday, the Gold Spot price XAU/USD faced selling pressure after Jerome Powell’s words at the Jackson Hole Symposium. The spot trades near the $1,910 area, where the 20 and 200-day Simple Moving Average (SMA) are about to perform a bearish cross.
Chair Powell stated that the Federal Reserve (Fed) needs to be cautious regarding the next meetings. He commented that the economy hasn’t cooled down as expected and that the bank will maintain its restrictive policy until it shows signs of cooling down. As he pointed out in July, it will all come down to the incoming data. The Fed will get an additional Nonfarm Payrolls and inflation report from August, and those data points will help investors model their expectations.
Reacting to the speech, US yields, which tend to be negatively correlated with non-yielding metal prices, rose with the 2-year rate leading towards 5.06%, seeing more than 0.80% gains. In line with that, the odds of a 25 basis point (bps) hike in November, according to the CME FedWatch tool, rose to 44%.
The technical analysis of the daily chart points to a neutral to a bearish outlook for XAU/USD, indicating a decline in the recent bullish strength. The Relative Strength Index (RSI) exhibits a negative slope below its midline, while the Moving Average Convergence (MACD) prints flat green bars.
Support levels: $1,900, $1,880, $1,850
Resistance levels: $1,915 (bearish cross between the 20 and 200-day SMA), $1,930, $1,950
Technical Levels: Supports and Resistances
XAUUSD currently trading at 1914.37 at the time of writing. Pair opened at 1916.92 and is trading with a change of -0.13 % .
| Overview | Overview.1 | |
|---|---|---|
| 0 | Today last price | 1914.37 |
| 1 | Today Daily Change | -2.55 |
| 2 | Today Daily Change % | -0.13 |
| 3 | Today daily open | 1916.92 |
The pair is trading below its 20 Daily moving average @ 1919.36, below its 50 Daily moving average @ 1931.59 , below its 100 Daily moving average @ 1958.96 and above its 200 Daily moving average @ 1909.38
| Trends | Trends.1 | |
|---|---|---|
| 0 | Daily SMA20 | 1919.36 |
| 1 | Daily SMA50 | 1931.59 |
| 2 | Daily SMA100 | 1958.96 |
| 3 | Daily SMA200 | 1909.38 |
The previous day high was 1923.43 while the previous day low was 1911.83. The daily 38.2% Fib levels comes at 1919.0, expected to provide resistance. Similarly, the daily 61.8% fib level is at 1916.26, expected to provide resistance.
Note the levels of interest below:
- Pivot support is noted at 1911.36, 1905.79, 1899.76
- Pivot resistance is noted at 1922.96, 1928.99, 1934.56
| Levels | Levels.1 |
|---|---|
| Previous Daily High | 1923.43 |
| Previous Daily Low | 1911.83 |
| Previous Weekly High | 1916.29 |
| Previous Weekly Low | 1885.13 |
| Previous Monthly High | 1987.54 |
| Previous Monthly Low | 1902.77 |
| Daily Fibonacci 38.2% | 1919.00 |
| Daily Fibonacci 61.8% | 1916.26 |
| Daily Pivot Point S1 | 1911.36 |
| Daily Pivot Point S2 | 1905.79 |
| Daily Pivot Point S3 | 1899.76 |
| Daily Pivot Point R1 | 1922.96 |
| Daily Pivot Point R2 | 1928.99 |
| Daily Pivot Point R3 | 1934.56 |
[/s2If]
Download Nehcap EAWe have two EAs that are operational on our LIVE accounts.
- EA-FIX: Check out the details here. Download EA-FIX . EA-FIX is a non-grid HFT scalper.
- EA-GROWTH: High quality low dd EA using trend grids. Download EA_GROWTHJoin Our Telegram Group
")


