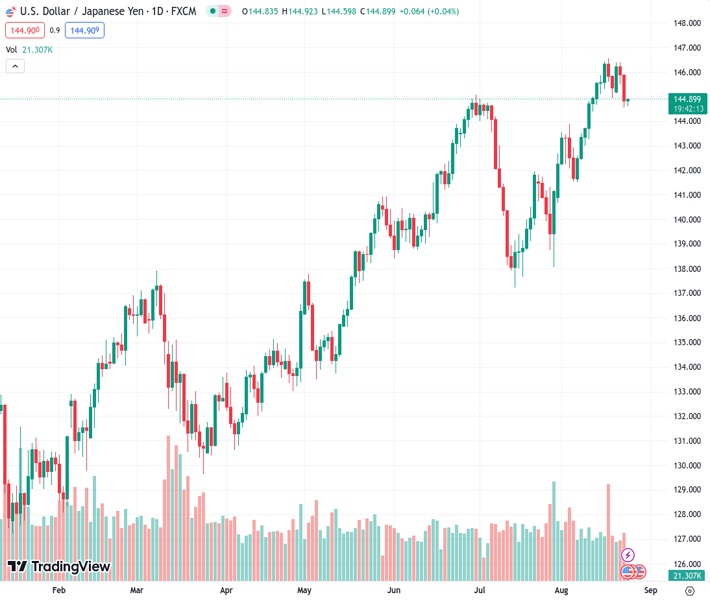
The USD/JPY currency pair dropped below the 145.00 level as US Treasury yields fell from their highest levels in several years.
…
This is a premium post.
[s2If !current_user_can(access_s2member_level4)]Please register for FREE REGISTER to read full post below containing analysis. In case of any error or you think you are not able to read the full post below, please email us at support#nehcap.com [lwa][/s2If] [s2If current_user_can(access_s2member_level1)]
- USD/JPY breaks below the 145.00 mark as US Treasury yields retreated from multi-year highs.
The pair currently trades last at 144.899.
The previous day high was 145.89 while the previous day low was 144.54. The daily 38.2% Fib levels comes at 145.06, expected to provide resistance. Similarly, the daily 61.8% fib level is at 145.38, expected to provide resistance.
The USD/JPY pair remains on the defensive during the early Asian trading hours on Thursday. The major pair currently trades around 144.80, down 0.03% for the day. The US Dollar (USD) edges lower as US Treasury yields retreated from multi-year highs and declines below 4.20%.
On Wednesday, Japan’s industrial activity contracted for the third consecutive month in August. The preliminary data from Jibun Bank revealed that Japan’s manufacturing PMI for August increased to 49.7 from 49.6. The result was lower than the 49.5 expected. While Service PMI rose from 53.8 to 54.3 over the same period. However, the downbeat first reading of S&P PMI data from the US, UK, and Eurozone fuels recession fears and increases demand for the Japanese Yen, a traditional safe-haven asset.
The US Dollar (USD) edges lower following the data showed that US Business activity in August expanded at a slow pace. That said, the preliminary S&P Global Composite PMI decreased to 50.4, down from 52.0 previously and below market expectations of 52.0. This is the largest decrease since November 2022. S&P Global Manufacturing PMI fell to 47 from 49 in the prior month, while Services PMI dropped to 51 from 52.4 in the previous month. Meanwhile, US annual New Home Sales came in at 714K, exceeding expectations of 705,000 by a significant margin.
Earlier this week, Federal Reserve Bank (Fed) of Richmond President Thomas Barkin said that monetary policy would need to be tightened if inflation remained elevated. Market players will take cues about the interest rates outlook from the Jackson Hole Symposium on Thursday. Hawkish comments from the central banks’ policymakers might limit the upside of the Japanese Yen and support the USD/JPY pair. That said, the monetary policy differential between the US and Japan is the main driver of the Yen’s weakening.
Looking ahead, the US weekly Jobless Claims and Durable Goods Orders will be due on Thursday. The Jackson Hole Symposium will be a closely watched event for traders. On Friday, the attention will shift to the Fed Chairman Jerome Powell’s Speech. The events will be critical for determining a clear movement for the USD/JPY pair.
Technical Levels: Supports and Resistances
USDJPY currently trading at 144.79 at the time of writing. Pair opened at 144.84 and is trading with a change of -0.03 % .
| Overview | Overview.1 | |
|---|---|---|
| 0 | Today last price | 144.79 |
| 1 | Today Daily Change | -0.05 |
| 2 | Today Daily Change % | -0.03 |
| 3 | Today daily open | 144.84 |
The pair remains strongly bullish on the daily timeframe. It trades above its 20 SMA @ 143.95, 50 SMA 142.66, 100 SMA @ 139.6 and 200 SMA @ 136.62.
| Trends | Trends.1 | |
|---|---|---|
| 0 | Daily SMA20 | 143.95 |
| 1 | Daily SMA50 | 142.66 |
| 2 | Daily SMA100 | 139.60 |
| 3 | Daily SMA200 | 136.62 |
The previous day high was 145.89 while the previous day low was 144.54. The daily 38.2% Fib levels comes at 145.06, expected to provide resistance. Similarly, the daily 61.8% fib level is at 145.38, expected to provide resistance.
Note the levels of interest below:
- Pivot support is noted at 144.29, 143.74, 142.94
- Pivot resistance is noted at 145.64, 146.44, 146.99
| Levels | Levels.1 |
|---|---|
| Previous Daily High | 145.89 |
| Previous Daily Low | 144.54 |
| Previous Weekly High | 146.56 |
| Previous Weekly Low | 144.65 |
| Previous Monthly High | 144.91 |
| Previous Monthly Low | 137.24 |
| Daily Fibonacci 38.2% | 145.06 |
| Daily Fibonacci 61.8% | 145.38 |
| Daily Pivot Point S1 | 144.29 |
| Daily Pivot Point S2 | 143.74 |
| Daily Pivot Point S3 | 142.94 |
| Daily Pivot Point R1 | 145.64 |
| Daily Pivot Point R2 | 146.44 |
| Daily Pivot Point R3 | 146.99 |
[/s2If]
Download Nehcap EAWe have two EAs that are operational on our LIVE accounts.
- EA-FIX: Check out the details here. Download EA-FIX . EA-FIX is a non-grid HFT scalper.
- EA-GROWTH: High quality low dd EA using trend grids. Download EA_GROWTHJoin Our Telegram Group
")


