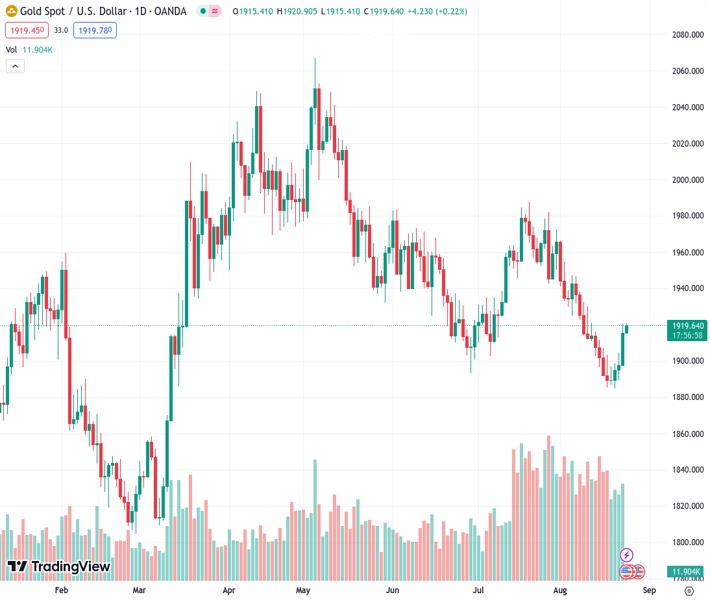
The price of gold has continued to rise for the fourth day in a row on Thursday, reaching 1,919.92 in the XAUUSD market.
…
This is a premium post.
[s2If !current_user_can(access_s2member_level4)]Please register for FREE REGISTER to read full post below containing analysis. In case of any error or you think you are not able to read the full post below, please email us at support#nehcap.com [lwa][/s2If] [s2If current_user_can(access_s2member_level1)]
- Gold price gains some positive traction for the fourth successive day on Thursday.
The pair currently trades last at 1919.92.
The previous day high was 1920.43 while the previous day low was 1897.34. The daily 38.2% Fib levels comes at 1911.61, expected to provide support. Similarly, the daily 61.8% fib level is at 1906.16, expected to provide support.
Gold price trades with a positive bias for the fourth successive day on Thursday and is currently placed just below the $1,920 area, or a nearly two-week high touched the previous day. The XAU/USD, however, lacks bullish conviction, warranting some caution before positioning for an extension of the recent bounce from the $1,885 zone, or the lowest level since March 13 touched earlier this week.
Against the backdrop of the worsening economic conditions in China, a host of manufacturing surveys released on Wednesday painted a grim picture of the health of economies across the globe. Furthermore, the dismal macro data from the United States (US) showed that business activity in the world’s largest economy approached the stagnation point in August. In fact, the S&P Global’s flash Composite US PMI registered its biggest drop since November 2022 and fell to 50.4 in August from the 52 previous. This adds to worries about a deeper global economic downturn and turns out to be a key factor acting as a tailwind for the safe-haven Gold price.
Apart from this, diminishing odds for further policy tightening by the Federal Reserve (Fed), which led to the overnight pullback in the yield on the benchmark 10-year US government bond from a 16-year peak, lends support to the non-yielding yellow metal. The markets, however, seem uncertain about the timing when the Fed will halt its rate-hiking cycle or even start cutting rates. This, along with the emergence of some US Dollar (USD) buying, might hold back traders from placing aggressive bullish bets around the Gold price.
In fact, the USD Index (DXY), which tracks the Greenback against a basket of currencies, now seems to have stalled its retracement slide from its highest level in more than two months touched on Wednesday. A modest USD strength could keep a lid on the US Dollar-denominated Gold price as investors keenly await Fed Chair Jerome Powell’s speech at the Jackson Hole Symposium on Friday. Investors will look for cues about the future rate-hike path, which will drive the USD demand and provide a fresh impetus to the XAU/USD.
Technical Levels: Supports and Resistances
XAUUSD currently trading at 1919.57 at the time of writing. Pair opened at 1915.6 and is trading with a change of 0.21 % .
| Overview | Overview.1 | |
|---|---|---|
| 0 | Today last price | 1919.57 |
| 1 | Today Daily Change | 3.97 |
| 2 | Today Daily Change % | 0.21 |
| 3 | Today daily open | 1915.60 |
The pair is trading below its 20 Daily moving average @ 1920.82, below its 50 Daily moving average @ 1932.42 , below its 100 Daily moving average @ 1960.0 and above its 200 Daily moving average @ 1908.66
| Trends | Trends.1 | |
|---|---|---|
| 0 | Daily SMA20 | 1920.82 |
| 1 | Daily SMA50 | 1932.42 |
| 2 | Daily SMA100 | 1960.00 |
| 3 | Daily SMA200 | 1908.66 |
The previous day high was 1920.43 while the previous day low was 1897.34. The daily 38.2% Fib levels comes at 1911.61, expected to provide support. Similarly, the daily 61.8% fib level is at 1906.16, expected to provide support.
Note the levels of interest below:
- Pivot support is noted at 1901.82, 1888.03, 1878.73
- Pivot resistance is noted at 1924.91, 1934.21, 1948.0
| Levels | Levels.1 |
|---|---|
| Previous Daily High | 1920.43 |
| Previous Daily Low | 1897.34 |
| Previous Weekly High | 1916.29 |
| Previous Weekly Low | 1885.13 |
| Previous Monthly High | 1987.54 |
| Previous Monthly Low | 1902.77 |
| Daily Fibonacci 38.2% | 1911.61 |
| Daily Fibonacci 61.8% | 1906.16 |
| Daily Pivot Point S1 | 1901.82 |
| Daily Pivot Point S2 | 1888.03 |
| Daily Pivot Point S3 | 1878.73 |
| Daily Pivot Point R1 | 1924.91 |
| Daily Pivot Point R2 | 1934.21 |
| Daily Pivot Point R3 | 1948.00 |
[/s2If]
Download Nehcap EAWe have two EAs that are operational on our LIVE accounts.
- EA-FIX: Check out the details here. Download EA-FIX . EA-FIX is a non-grid HFT scalper.
- EA-GROWTH: High quality low dd EA using trend grids. Download EA_GROWTHJoin Our Telegram Group
")


