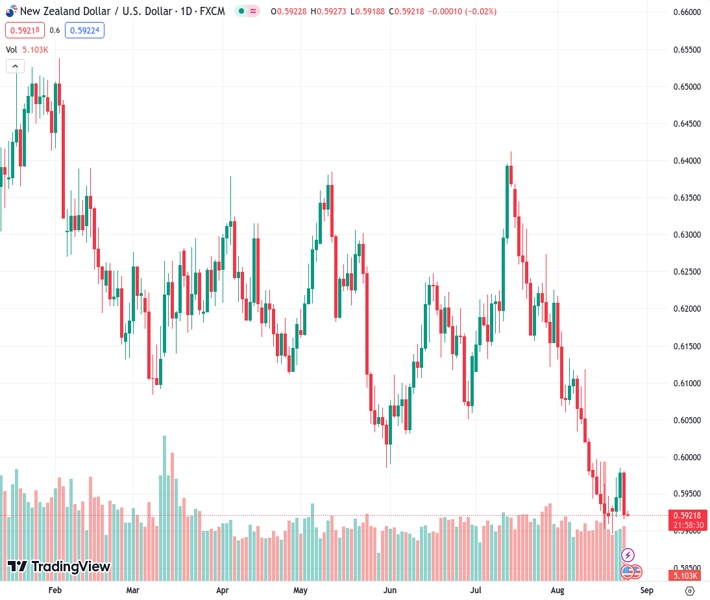
The NZDUSD pair, currently at 0.59200, is experiencing a slowdown in momentum around the 0.5925 level due to the increased demand for the USD.
…
This is a premium post.
[s2If !current_user_can(access_s2member_level4)]Please register for FREE REGISTER to read full post below containing analysis. In case of any error or you think you are not able to read the full post below, please email us at support#nehcap.com [lwa][/s2If] [s2If current_user_can(access_s2member_level1)]
- NZD/USD loses traction near 0.5925 amid the USD demand.
The pair currently trades last at 0.59200.
The previous day high was 0.5987 while the previous day low was 0.5927. The daily 38.2% Fib levels comes at 0.5964, expected to provide resistance. Similarly, the daily 61.8% fib level is at 0.595, expected to provide resistance.
The NZD/USD pair faces some follow-through selling and drops to 0.5925 during the early Asian session on Friday. The US Dollar Index (DXY) falls to its lowest level since early June and rebounds to the 104.00 area, supported by risk aversion and higher US Treasury yields.
At the Jackson Hole Symposium, Federal Reserve Bank of Philadelphia President Patrick Harker stated that the central bank has probably done enough with restrictive monetary policy. He also said that he believes the Fed will remain interest rate stable this year, but that next year would depend on the data. While, Boston Federal Reserve President Susan Collins said further rate rises are possible and that sending a strong signal regarding the timing of rate cuts is premature.
About the data, US Durable Goods Orders MoM for July fell -5.2%, above estimations of -4% and below the 4.4% gain in the previous month. This is the biggest decline since April 2020. Furthermore, the Chicago Fed National Activity Index for July increased to 0.12 from -0.33 prior, while the Kansas Fed Manufacturing Activity Index for August rose to 12.0 from -20.0 previously.
Lastly, the weekly figures provided by the US Department of Labour (DOL) on Thursday indicated that Initial Jobless Claims reached 230K in the week ending August 19. The figure came in below 240k expected and prior. The reading is the lowest in three weeks.
New Zealand’s economic calendar remains empty. Earlier this week, Statistics New Zealand released second-quarter Retail Sales QoQ figures, showing an increase to -1.0 from -1.6% prior and better than expected of -2.6%. The chief economist of the Reserve Bank of New Zealand (RBNZ) said that policymakers would lower the OCR sooner than we have signaled if China experienced a more significant deceleration than the RBNZ anticipates.
Looking ahead, investors will closely watch Friday’s speech from Jerome Powell. The speech could provide insights into economic conditions and hints as to whether inflation is under control or whether additional interest rate hikes are required to combat inflation. The events will be critical for determining a clear movement for the NZD/USD pair.
Technical Levels: Supports and Resistances
NZDUSD currently trading at 0.5924 at the time of writing. Pair opened at 0.598 and is trading with a change of -0.94 % .
| Overview | Overview.1 | |
|---|---|---|
| 0 | Today last price | 0.5924 |
| 1 | Today Daily Change | -0.0056 |
| 2 | Today Daily Change % | -0.9400 |
| 3 | Today daily open | 0.5980 |
The pair remains strongly bearish on the daily time frame. It trades below the 20 SMA @ 0.6037, 50 SMA 0.6138, 100 SMA @ 0.6159 and 200 SMA @ 0.6229.
| Trends | Trends.1 | |
|---|---|---|
| 0 | Daily SMA20 | 0.6037 |
| 1 | Daily SMA50 | 0.6138 |
| 2 | Daily SMA100 | 0.6159 |
| 3 | Daily SMA200 | 0.6229 |
The previous day high was 0.5987 while the previous day low was 0.5927. The daily 38.2% Fib levels comes at 0.5964, expected to provide resistance. Similarly, the daily 61.8% fib level is at 0.595, expected to provide resistance.
Note the levels of interest below:
- Pivot support is noted at 0.5942, 0.5905, 0.5883
- Pivot resistance is noted at 0.6002, 0.6024, 0.6062
| Levels | Levels.1 |
|---|---|
| Previous Daily High | 0.5987 |
| Previous Daily Low | 0.5927 |
| Previous Weekly High | 0.5997 |
| Previous Weekly Low | 0.5903 |
| Previous Monthly High | 0.6413 |
| Previous Monthly Low | 0.6120 |
| Daily Fibonacci 38.2% | 0.5964 |
| Daily Fibonacci 61.8% | 0.5950 |
| Daily Pivot Point S1 | 0.5942 |
| Daily Pivot Point S2 | 0.5905 |
| Daily Pivot Point S3 | 0.5883 |
| Daily Pivot Point R1 | 0.6002 |
| Daily Pivot Point R2 | 0.6024 |
| Daily Pivot Point R3 | 0.6062 |
[/s2If]
Download Nehcap EAWe have two EAs that are operational on our LIVE accounts.
- EA-FIX: Check out the details here. Download EA-FIX . EA-FIX is a non-grid HFT scalper.
- EA-GROWTH: High quality low dd EA using trend grids. Download EA_GROWTHJoin Our Telegram Group
")


