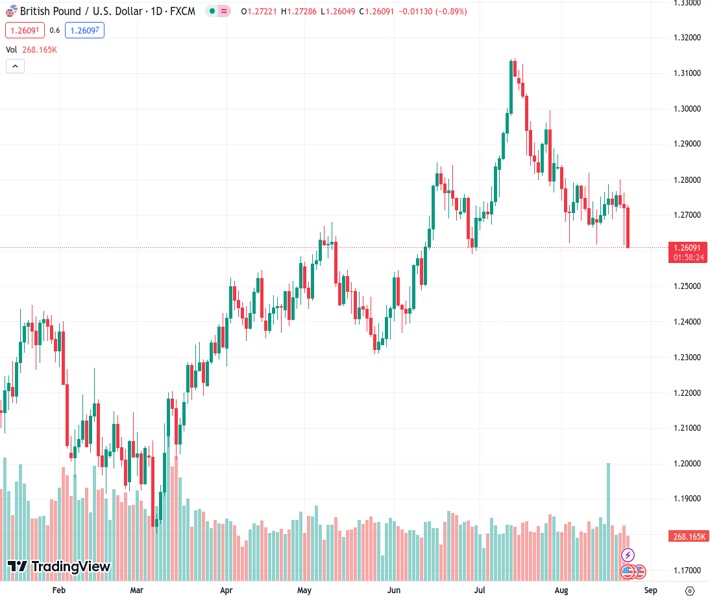
The GBPUSD currency pair is currently trading at a rate of 1.26066. The latest data on US Durable Goods Orders for the month of July reveals a substantial decrease of -5.2% compared to the previous month, surpassing expectations and representing the largest decline since April 2020.
…
This is a premium post.
[s2If !current_user_can(access_s2member_level4)]Please register for FREE REGISTER to read full post below containing analysis. In case of any error or you think you are not able to read the full post below, please email us at support#nehcap.com [lwa][/s2If] [s2If current_user_can(access_s2member_level1)]
- US Durable Goods Orders for July show a significant decline of -5.2% MoM, exceeding estimates and marking the biggest drop since April 2020.
The pair currently trades last at 1.26066.
The previous day high was 1.2765 while the previous day low was 1.2615. The daily 38.2% Fib levels comes at 1.2672, expected to provide resistance. Similarly, the daily 61.8% fib level is at 1.2708, expected to provide resistance.
The Pound Sterling (GBP) drops sharply late in the New York session vs. the US Dollar (USD) and exchanges hands below the 1.2700 figure on Thursday, losing 0.85%. Federal Reserve officials hawkish stance, alongside weak economic data in the United Kingdom (UK), sponsored the GBP/USD fall, which trades at 1.2615 after hitting a high of 1.2728.
Two Federal Reserve officials crossed news wires as the Jackson Hole event began. Firstly, the Philadelphia Fed President Patrick Harker said the US central bank must keep its current restrictive stance while acknowledging that the economy would suffer a slowdown. After that, Boston Fed President Susan Collins expressed the Fed “may be” at a sufficiently restrictive level but kept the door open for additional hikes. She added that it’s premature to talk about rate cuts.
Data-wise, the US economic docket witnessed a slowdown in long-lasting goods, as the US Commerce Department revealed. Durable Goods Orders in July plunged by –5.2 % MoM, exceeded estimates of -4%, and trailed well below the 4.4% increase a month ago; it was the biggest decline since April 2020.
Digging into the data, excluding transportation, the reading was positive for four straight months, with orders rising 0.5% in July and up from 0.2% in June. Other data, revealed by the US Department of Labor, showed the labor market remains tight, as unemployment claims for the week ending August 19 rose by 230K, below estimates of 240K and 9K below the previous week.
Aside from this, the release of weaker Retail Sales in the UK and Wednesday’s disastrous PMI figures deepening further below the 50 lines, seen as expansion/contraction level, reignited recession fears. Hence, money market futures adjusted Bank of England’s (BoE) rate hike expectations, with most market participants expecting two additional rate hikes, as they see rates peaking at 5.75%.
Given the backdrop, the strength of the US economy can boost the Greenback’s (USD) scenario and keep the GBP/USD exchange rate downward pressured. If BoE officials give any dovish signals, expect the pair to fall towards the 200-day SMA at 1.2394.
From a technical perspective, the GBP/USD is neutral to downward biased, with the pair unable to crack the 50-day Simple Moving Average (SMA) at 1.2791, which acted as resistance. However, buyers could remain hopeful the 1.2600 level would hold unless sellers drag the major below and achieve a daily close below the latter. If the GBP/USD drops below 1.2600, the next support would be the 1.2500 mark. Conversely, the pair would remain trading within the 150 pip range of 1.2600-1.2750.
Technical Levels: Supports and Resistances
GBPUSD currently trading at 1.2608 at the time of writing. Pair opened at 1.2726 and is trading with a change of -0.93 % .
| Overview | Overview.1 | |
|---|---|---|
| 0 | Today last price | 1.2608 |
| 1 | Today Daily Change | -0.0118 |
| 2 | Today Daily Change % | -0.9300 |
| 3 | Today daily open | 1.2726 |
The pair is trading below its 20 Daily moving average @ 1.2743, below its 50 Daily moving average @ 1.2796 , below its 100 Daily moving average @ 1.2637 and above its 200 Daily moving average @ 1.2392
| Trends | Trends.1 | |
|---|---|---|
| 0 | Daily SMA20 | 1.2743 |
| 1 | Daily SMA50 | 1.2796 |
| 2 | Daily SMA100 | 1.2637 |
| 3 | Daily SMA200 | 1.2392 |
The previous day high was 1.2765 while the previous day low was 1.2615. The daily 38.2% Fib levels comes at 1.2672, expected to provide resistance. Similarly, the daily 61.8% fib level is at 1.2708, expected to provide resistance.
Note the levels of interest below:
- Pivot support is noted at 1.2639, 1.2552, 1.2489
- Pivot resistance is noted at 1.2789, 1.2852, 1.2939
| Levels | Levels.1 |
|---|---|
| Previous Daily High | 1.2765 |
| Previous Daily Low | 1.2615 |
| Previous Weekly High | 1.2788 |
| Previous Weekly Low | 1.2617 |
| Previous Monthly High | 1.3142 |
| Previous Monthly Low | 1.2659 |
| Daily Fibonacci 38.2% | 1.2672 |
| Daily Fibonacci 61.8% | 1.2708 |
| Daily Pivot Point S1 | 1.2639 |
| Daily Pivot Point S2 | 1.2552 |
| Daily Pivot Point S3 | 1.2489 |
| Daily Pivot Point R1 | 1.2789 |
| Daily Pivot Point R2 | 1.2852 |
| Daily Pivot Point R3 | 1.2939 |
[/s2If]
Download Nehcap EAWe have two EAs that are operational on our LIVE accounts.
- EA-FIX: Check out the details here. Download EA-FIX . EA-FIX is a non-grid HFT scalper.
- EA-GROWTH: High quality low dd EA using trend grids. Download EA_GROWTHJoin Our Telegram Group
")


