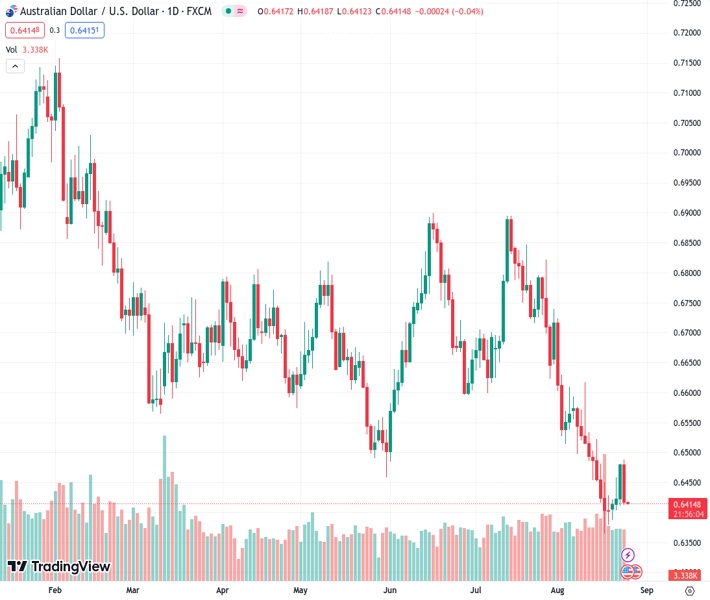
The AUDUSD pair is influenced by the bearish remarks made by Federal Reserve representatives Patrick Harker and Susan Collins, causing the pair’s value to decline.
…
This is a premium post.
[s2If !current_user_can(access_s2member_level4)]Please register for FREE REGISTER to read full post below containing analysis. In case of any error or you think you are not able to read the full post below, please email us at support#nehcap.com [lwa][/s2If] [s2If current_user_can(access_s2member_level1)]
- Hawkish comments from Federal Reserve officials Patrick Harker and Susan Collins weigh on the pair.
The pair currently trades last at 0.64160.
The previous day high was 0.6482 while the previous day low was 0.6411. The daily 38.2% Fib levels comes at 0.6455, expected to provide resistance. Similarly, the daily 61.8% fib level is at 0.6438, expected to provide resistance.
The Australian Dollar (AUD) erased Wednesday’s gains against the American Dollar (USD) on Thursday, as a ‘bearish-engulfing’ candlestick chart pattern emerges, suggesting that further downside is expected. On Thursday, the hawkish commentary by Fed officials, alongside weaker-than-expected economic data from Australia in August, paints a gloomy economic outlook for the Aussie. The AUD/USD changes hands at 0.6412 after retreating from weekly highs of 0.6488, almost flat as the Asian session starts.
Market participants focus shifts to Fed Chair Jay Powell’s speech at Jackson Hole on Friday. A few Federal Reserve policymakers delivered an intro, which struck the markets with hawkish remarks, though both commented that the Federal Fund Rate (FFR) is about to peak. Patrick Harker from the Philadelphia Fed said rates must remain at current “restrictive” levels while acknowledging the US economy will cool off. In the meantime, Boston Fed President Susan Collins said rates are at a “sufficiently restrictive level” but kept the door open for more increases while pushing rate cuts off the table.
The US economic agenda delivered a mixed report on long-lasting goods, with Durable Goods Orders for July plunging, while core figures were above estimates. At the same time, the US Bureau of Labor Statistics (BLS) showed that Initial Jobless Claims for the week ending August 19 were below forecasts at 230K, with estimates of 239K, portraying the tightness of the labor market.
Given the backdrop, the greenback advanced, as seen by the AUD/USD dropping below the 0.6450 psychological level. In the meantime, the US Dollar Index, a measure of the buck’s value versus six currencies, touched a fresh two-month high at 104.027 but ended Thursday’s session at 103.993, gaining 0.61%.
On the Australian front, August’s data has not been good for the Australian economy, while China’s woes weakened the AUD. Given that employment data was weaker, wages came below the prior month, the economy slashing employment, and an unemployment rate ticking towards 4%, the Reserve Bank of Australia (RBA) is expected to keep rates unchanged at the September meeting. The lack of economic data would keep traders focused on Powell’s speech and next week, RBA’s upcoming Governor Michelle Bullock would speak on August 29.
The AUD/USD is set to extend its downtrend after pausing during the first three days of the week. Thursday’s reversal opened the door to test the 0.6400 figure. A clear break will expose the November 10 daily low of 0.6386, ahead of challenging the year-to-date (YTD) low of 0.6264. It should be said that an extension past the YTD low would reinforce the downtrend, with sellers eyeing 0.6300. On the contrary, if buyers want to remain hopeful of higher prices, the pair must stay above 0.6400, with the current week’s high of 0.6488 seen as the first resistance, followed by 0.6500.
Technical Levels: Supports and Resistances
AUDUSD currently trading at 0.6418 at the time of writing. Pair opened at 0.6481 and is trading with a change of -0.97 % .
| Overview | Overview.1 | |
|---|---|---|
| 0 | Today last price | 0.6418 |
| 1 | Today Daily Change | -0.0063 |
| 2 | Today Daily Change % | -0.9700 |
| 3 | Today daily open | 0.6481 |
The pair remains strongly bearish on the daily time frame. It trades below the 20 SMA @ 0.6525, 50 SMA 0.6656, 100 SMA @ 0.666 and 200 SMA @ 0.673.
| Trends | Trends.1 | |
|---|---|---|
| 0 | Daily SMA20 | 0.6525 |
| 1 | Daily SMA50 | 0.6656 |
| 2 | Daily SMA100 | 0.6660 |
| 3 | Daily SMA200 | 0.6730 |
The previous day high was 0.6482 while the previous day low was 0.6411. The daily 38.2% Fib levels comes at 0.6455, expected to provide resistance. Similarly, the daily 61.8% fib level is at 0.6438, expected to provide resistance.
Note the levels of interest below:
- Pivot support is noted at 0.6434, 0.6387, 0.6363
- Pivot resistance is noted at 0.6505, 0.6528, 0.6575
| Levels | Levels.1 |
|---|---|
| Previous Daily High | 0.6482 |
| Previous Daily Low | 0.6411 |
| Previous Weekly High | 0.6522 |
| Previous Weekly Low | 0.6364 |
| Previous Monthly High | 0.6895 |
| Previous Monthly Low | 0.6599 |
| Daily Fibonacci 38.2% | 0.6455 |
| Daily Fibonacci 61.8% | 0.6438 |
| Daily Pivot Point S1 | 0.6434 |
| Daily Pivot Point S2 | 0.6387 |
| Daily Pivot Point S3 | 0.6363 |
| Daily Pivot Point R1 | 0.6505 |
| Daily Pivot Point R2 | 0.6528 |
| Daily Pivot Point R3 | 0.6575 |
[/s2If]
Download Nehcap EAWe have two EAs that are operational on our LIVE accounts.
- EA-FIX: Check out the details here. Download EA-FIX . EA-FIX is a non-grid HFT scalper.
- EA-GROWTH: High quality low dd EA using trend grids. Download EA_GROWTHJoin Our Telegram Group
")


