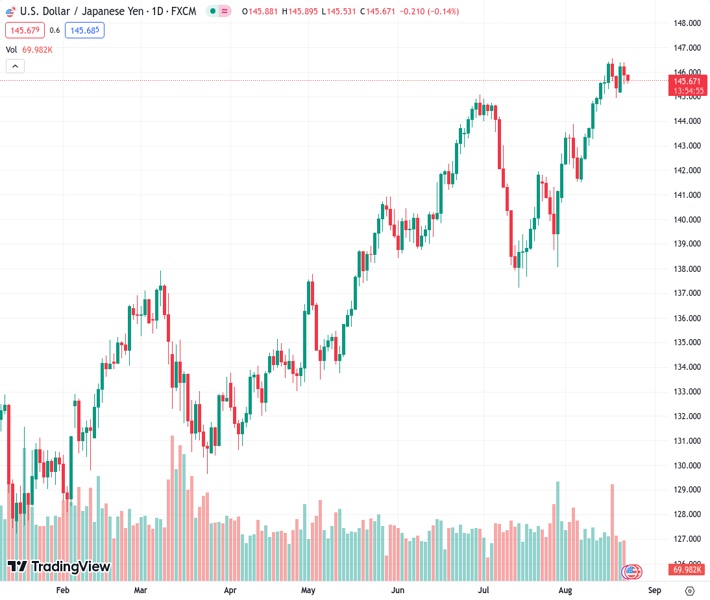
The USDJPY pair, which was trading at 145.684, is now around 145.62, experiencing a decrease of 0.19% throughout the day.
…
This is a premium post.
[s2If !current_user_can(access_s2member_level4)]Please register for FREE REGISTER to read full post below containing analysis. In case of any error or you think you are not able to read the full post below, please email us at support#nehcap.com [lwa][/s2If] [s2If current_user_can(access_s2member_level1)]
- USD/JPY currently trades near 145.62, losing 0.19% on the day.
The pair currently trades last at 145.684.
The previous day high was 146.4 while the previous day low was 145.5. The daily 38.2% Fib levels comes at 145.84, expected to provide resistance. Similarly, the daily 61.8% fib level is at 146.06, expected to provide resistance.
The USD/JPY loses momentum but holds above the 145.60 mark heading into the early European session on Wednesday. Markets turn cautious ahead of the US S&P Global PMI data due later in the North American session. The major pair currently trades near 145.62, losing 0.19% on the day.
Japan’s manufacturing shrank for a third straight month in August, according to the latest figures released on Wednesday. Jibun Bank’s flash PMI reading for Japan’s manufacturing sector in August showed a rise to 49.7 from 49.6. The figure was under the predicted 49.5. While the Service PMI increased from 53.8 to 54.3.
Technically, the USD/JPY pair stands above the 50- and 100-hour Exponential Moving Averages (EMAs) with an upward slope, which means the path of least resistance is to the upside for the major pair.
The immediate resistance level for USD/JPY appears at 145.85 (a high of August 15). The additional upside filter to watch is seen at a high of August 21 and the upper boundary of the Bollinger Band of 146.35. Any meaningful follow-through buying above the latter would challenge a Year-To-Date (YTD) high of 146.55. Further north, at 147.00 will be a tough nut to crack for the USD/JPY pair.
On the flip side, the initial contention for the major pair is located at 145.30 (50-hour EMA). The next contention level emerges near a psychological round figure at 145.00. Any intraday pullback below the latter would expose the next downside stop at 144.45 (100-hour EMA) en route to 144.00 (round mark), and finally at 143.30 (low of August 10).
It’s worth noting that the Relative Strength Index (RSI) stands in bearish territory below 50, which indicates that the downside momentum has been activated for the time being.
Technical Levels: Supports and Resistances
USDJPY currently trading at 145.55 at the time of writing. Pair opened at 145.89 and is trading with a change of -0.23 % .
| Overview | Overview.1 | |
|---|---|---|
| 0 | Today last price | 145.55 |
| 1 | Today Daily Change | -0.34 |
| 2 | Today Daily Change % | -0.23 |
| 3 | Today daily open | 145.89 |
The pair remains strongly bullish on the daily timeframe. It trades above its 20 SMA @ 143.72, 50 SMA 142.57, 100 SMA @ 139.47 and 200 SMA @ 136.6.
| Trends | Trends.1 | |
|---|---|---|
| 0 | Daily SMA20 | 143.72 |
| 1 | Daily SMA50 | 142.57 |
| 2 | Daily SMA100 | 139.47 |
| 3 | Daily SMA200 | 136.60 |
The previous day high was 146.4 while the previous day low was 145.5. The daily 38.2% Fib levels comes at 145.84, expected to provide resistance. Similarly, the daily 61.8% fib level is at 146.06, expected to provide resistance.
Note the levels of interest below:
- Pivot support is noted at 145.46, 145.03, 144.56
- Pivot resistance is noted at 146.36, 146.83, 147.27
| Levels | Levels.1 |
|---|---|
| Previous Daily High | 146.40 |
| Previous Daily Low | 145.50 |
| Previous Weekly High | 146.56 |
| Previous Weekly Low | 144.65 |
| Previous Monthly High | 144.91 |
| Previous Monthly Low | 137.24 |
| Daily Fibonacci 38.2% | 145.84 |
| Daily Fibonacci 61.8% | 146.06 |
| Daily Pivot Point S1 | 145.46 |
| Daily Pivot Point S2 | 145.03 |
| Daily Pivot Point S3 | 144.56 |
| Daily Pivot Point R1 | 146.36 |
| Daily Pivot Point R2 | 146.83 |
| Daily Pivot Point R3 | 147.27 |
[/s2If]
Download Nehcap EAWe have two EAs that are operational on our LIVE accounts.
- EA-FIX: Check out the details here. Download EA-FIX . EA-FIX is a non-grid HFT scalper.
- EA-GROWTH: High quality low dd EA using trend grids. Download EA_GROWTHJoin Our Telegram Group
")


