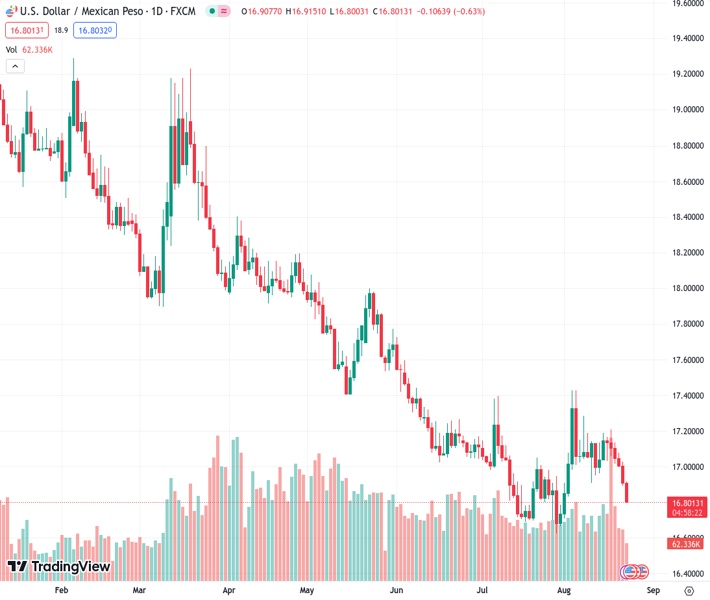
The US dollar to Mexican peso exchange rate, currently at 16.8024, has decreased by 0.48% and is now being traded at 16.8260. This decline is attributed to the negative impact of disappointing S&P Global PMIs on the US dollar.
…
This is a premium post.
[s2If !current_user_can(access_s2member_level4)]Please register for FREE REGISTER to read full post below containing analysis. In case of any error or you think you are not able to read the full post below, please email us at support#nehcap.com [lwa][/s2If] [s2If current_user_can(access_s2member_level1)]
- USD/MXN is down 0.48%, trading at 16.8260, as disappointing S&P Global PMIs weigh on the greenback.
The pair currently trades last at 16.8024.
The previous day high was 17.0301 while the previous day low was 16.8943. The daily 38.2% Fib levels comes at 16.9462, expected to provide resistance. Similarly, the daily 61.8% fib level is at 16.9782, expected to provide resistance.
USD/MXN plunges for the fifth straight day after economic data from the United States (US) could prevent the US Federal Reserve from tightening monetary conditions, as business activity deteriorated, according to S&P Global. Hence, the USD/MXN trades at 16.8260, down 0.48%, after hitting a daily high of 16.9151.
US equities are trading in the green on expectations of NVIDIA earnings reports and US S&P Global PMIs for August. The S&P Global Composite PMI compounded by Manufacturing and Services PMIs fell to 50.4 from July 52 and below estimates of 52. The manufacturing index dived deeper into contractionary territory at 47 from 49 July and forecasts of 49.3, while the services component clings to expansionary territory at 51, also missing estimates of 52.2.
Other data on the housing market witnessed New Home Sales for July on MoM came at 4.4%, exceeding the prior month’s data of -2.8%.
In the meantime, a US government report revealed that US Nonfarm Payrolls through March would probably be revised down by 306,000, smaller than analysts’ estimates of 500,000.
US Treasury bond yields remain depressed along the whole yield curve as the 10-year Treasury Note collapses ten basis points, from 4.321% to 4.22%, weighing on the greenback. The US Dollar Index (DXY), a gauge that measures the buck’s value against a basket of peers, drops 0.21% at 103.380.
On the Mexican front, the economic agenda would remain empty until Thursday, when the Instituto Nacional de Estadistica Geografia e Informatica (INEGI) will reveal inflation figures for the first half of August, with the Consumer Price Index (CPI) estimated at 4.67% on YoY, while monthly figures are expected at 0.28%. Core CPI is projected to slow down but remain stickier than expected.
Given the backdrop, USD/MXN remains bearishly biased and ready to test the yearly lows. However, the Jackson Hole speech by Fed Chair Jerome Powell is expected to rock the boat. Investors estimate the Fed would stick to its higher-for-longer commitment and talk down the chances of interest rate cuts.
From a technical standpoint, the USD/MXN is downward biased, set to re-test the year-to-date (YTD) low of 16.6238, which, once cleared, the pair would continue towards the October 2015 low of 16.3267. Conversely, if USD/MXN edges back toward the confluence of the 20/50-day Moving Average (DMA) at 17.0000, that could pave the way for further upside. Next would be the last week’s high of 17.2073, followed by the 100-DMA at 17.3862.
Technical Levels: Supports and Resistances
USDMXN currently trading at 16.8134 at the time of writing. Pair opened at 16.9114 and is trading with a change of -0.58 % .
| Overview | Overview.1 | |
|---|---|---|
| 0 | Today last price | 16.8134 |
| 1 | Today Daily Change | -0.0980 |
| 2 | Today Daily Change % | -0.5800 |
| 3 | Today daily open | 16.9114 |
The pair remains strongly bearish on the daily time frame. It trades below the 20 SMA @ 17.0137, 50 SMA 17.0168, 100 SMA @ 17.4077 and 200 SMA @ 18.1666.
| Trends | Trends.1 | |
|---|---|---|
| 0 | Daily SMA20 | 17.0137 |
| 1 | Daily SMA50 | 17.0168 |
| 2 | Daily SMA100 | 17.4077 |
| 3 | Daily SMA200 | 18.1666 |
The previous day high was 17.0301 while the previous day low was 16.8943. The daily 38.2% Fib levels comes at 16.9462, expected to provide resistance. Similarly, the daily 61.8% fib level is at 16.9782, expected to provide resistance.
Note the levels of interest below:
- Pivot support is noted at 16.8604, 16.8095, 16.7247
- Pivot resistance is noted at 16.9962, 17.081, 17.1319
| Levels | Levels.1 |
|---|---|
| Previous Daily High | 17.0301 |
| Previous Daily Low | 16.8943 |
| Previous Weekly High | 17.2094 |
| Previous Weekly Low | 16.9663 |
| Previous Monthly High | 17.3957 |
| Previous Monthly Low | 16.6258 |
| Daily Fibonacci 38.2% | 16.9462 |
| Daily Fibonacci 61.8% | 16.9782 |
| Daily Pivot Point S1 | 16.8604 |
| Daily Pivot Point S2 | 16.8095 |
| Daily Pivot Point S3 | 16.7247 |
| Daily Pivot Point R1 | 16.9962 |
| Daily Pivot Point R2 | 17.0810 |
| Daily Pivot Point R3 | 17.1319 |
[/s2If]
Download Nehcap EAWe have two EAs that are operational on our LIVE accounts.
- EA-FIX: Check out the details here. Download EA-FIX . EA-FIX is a non-grid HFT scalper.
- EA-GROWTH: High quality low dd EA using trend grids. Download EA_GROWTHJoin Our Telegram Group
")


