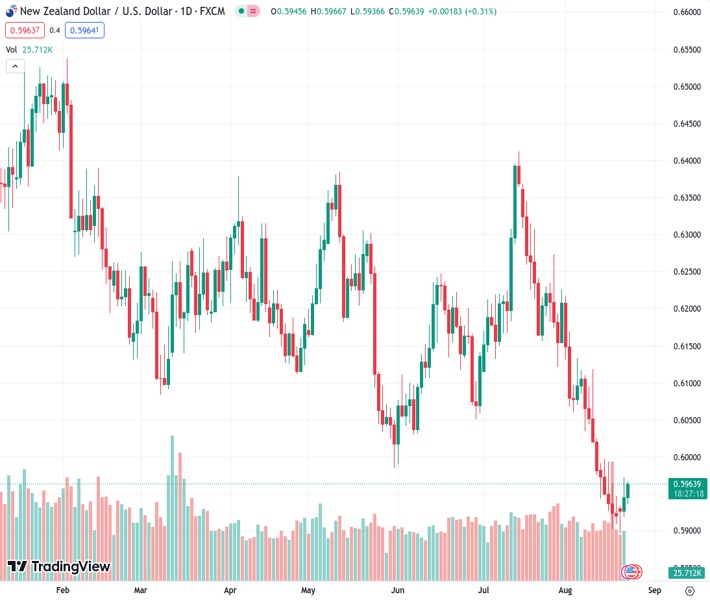
The NZDUSD currency pair at a rate of 0.59615 experienced some continued upward movement on Wednesday due to a slight weakness in the USD.
…
This is a premium post.
[s2If !current_user_can(access_s2member_level4)]Please register for FREE REGISTER to read full post below containing analysis. In case of any error or you think you are not able to read the full post below, please email us at support#nehcap.com [lwa][/s2If] [s2If current_user_can(access_s2member_level1)]
- NZD/USD gains some follow-through traction on Wednesday amid a modest USD weakness.
The pair currently trades last at 0.59615.
The previous day high was 0.5973 while the previous day low was 0.5918. The daily 38.2% Fib levels comes at 0.5952, expected to provide support. Similarly, the daily 61.8% fib level is at 0.5939, expected to provide support.
The NZD/USD pair attracts some dip-buying during the Asian session on Wednesday and climbs to a fresh daily high, around the 0.5965 region in the last hour. Spot prices move back above the 200-hour Simple Moving Average (SMA) and might now look to build on the recovery from sub-0.5900 levels or the lowest level since November 2022 touched earlier this week.
The intraday uptick is sponsored by a modest US Dollar (USD) downtick, led by some profit-taking in the wake of a mildly softer tone surrounding the US Treasury bond yields and against the backdrop of the recent rise to a more than two-month peak. Apart from this, hopes for more stimulus from China, along with signs of easing US-China trade tensions, further benefit antipodean currencies, including the New Zealand Dollar (NZD).
It is worth recalling that the US Commerce Department’s Bureau of Industry and Security (BIS) announced on Monday that it will remove 27 Chinese entities out of its Unverified List. China welcomed the move and said that it is conducive to normal trade between the two nations. This comes ahead of US Secretary of Commerce Gina Raimondo’s visit to China on August 27-30, for meetings with senior Chinese officials and US business leaders.
That said, growing concerns about the worsening economic conditions in China should keep a lid on the optimism in the markets and the risk-sensitive Kiwi, which reacted little to rather unimpressive domestic data. In fact, Statistics New Zealand reported that Retail Sales declined by 1% during the second quarter (Q2) of 2023, marking an improvement from the 1.6% fall in the previous quarter and beating estimates for a 2.6% contraction.
Furthermore, the Reserve Bank of New Zealand (RBNZ) had already indicated that it was done raising rates. This, along with firming expectations that the Federal Reserve (Fed) will keep interest rates higher for longer, warrants some caution before placing aggressive bullish bets around the NZD/USD pair. Market participants now look forward to the release of the flash PMI prints from the US for some meaningful impetus.
The focus, however, will remain glued to the crucial Jackson Hole Symposium, where comments by Fed Chair Jerome Powell will be scrutinized closely for clues about the future rate-hike path. This, in turn, will play a key role in influencing the near-term USD price dynamics and help determine the next leg of a directional move for the NZD/USD pair.
Technical Levels: Supports and Resistances
NZDUSD currently trading at 0.5965 at the time of writing. Pair opened at 0.5946 and is trading with a change of 0.32 % .
| Overview | Overview.1 | |
|---|---|---|
| 0 | Today last price | 0.5965 |
| 1 | Today Daily Change | 0.0019 |
| 2 | Today Daily Change % | 0.3200 |
| 3 | Today daily open | 0.5946 |
The pair remains strongly bearish on the daily time frame. It trades below the 20 SMA @ 0.6048, 50 SMA 0.6142, 100 SMA @ 0.6162 and 200 SMA @ 0.623.
| Trends | Trends.1 | |
|---|---|---|
| 0 | Daily SMA20 | 0.6048 |
| 1 | Daily SMA50 | 0.6142 |
| 2 | Daily SMA100 | 0.6162 |
| 3 | Daily SMA200 | 0.6230 |
The previous day high was 0.5973 while the previous day low was 0.5918. The daily 38.2% Fib levels comes at 0.5952, expected to provide support. Similarly, the daily 61.8% fib level is at 0.5939, expected to provide support.
Note the levels of interest below:
- Pivot support is noted at 0.5918, 0.5891, 0.5863
- Pivot resistance is noted at 0.5973, 0.6001, 0.6028
| Levels | Levels.1 |
|---|---|
| Previous Daily High | 0.5973 |
| Previous Daily Low | 0.5918 |
| Previous Weekly High | 0.5997 |
| Previous Weekly Low | 0.5903 |
| Previous Monthly High | 0.6413 |
| Previous Monthly Low | 0.6120 |
| Daily Fibonacci 38.2% | 0.5952 |
| Daily Fibonacci 61.8% | 0.5939 |
| Daily Pivot Point S1 | 0.5918 |
| Daily Pivot Point S2 | 0.5891 |
| Daily Pivot Point S3 | 0.5863 |
| Daily Pivot Point R1 | 0.5973 |
| Daily Pivot Point R2 | 0.6001 |
| Daily Pivot Point R3 | 0.6028 |
[/s2If]
Download Nehcap EAWe have two EAs that are operational on our LIVE accounts.
- EA-FIX: Check out the details here. Download EA-FIX . EA-FIX is a non-grid HFT scalper.
- EA-GROWTH: High quality low dd EA using trend grids. Download EA_GROWTHJoin Our Telegram Group
")


