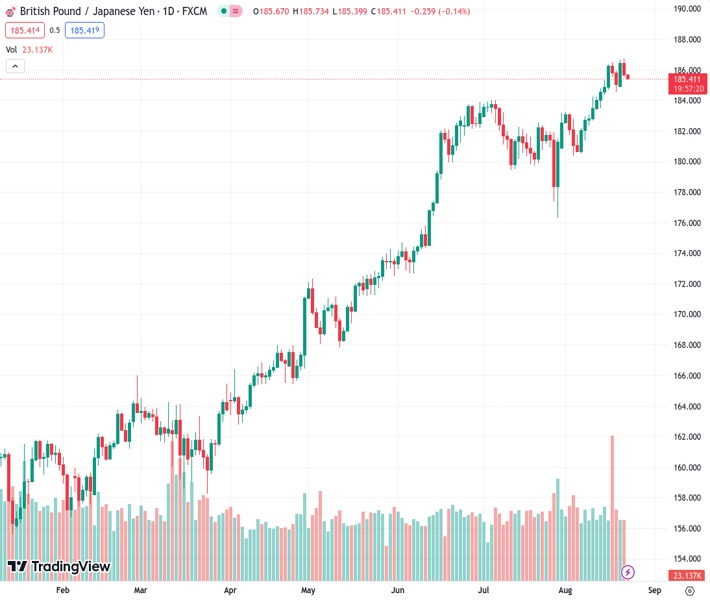
The GBPJPY pair at a rate of 185.483 continues to decline after reaching its highest point since November 2015, showing recent signs of sluggishness.
…
This is a premium post.
[s2If !current_user_can(access_s2member_level4)]Please register for FREE REGISTER to read full post below containing analysis. In case of any error or you think you are not able to read the full post below, please email us at support#nehcap.com [lwa][/s2If] [s2If current_user_can(access_s2member_level1)]
- GBP/JPY extends Tuesday’s pullback from the highest level since November 2015, sluggish of late.
The pair currently trades last at 185.483.
The previous day high was 186.77 while the previous day low was 185.54. The daily 38.2% Fib levels comes at 186.01, expected to provide resistance. Similarly, the daily 61.8% fib level is at 186.3, expected to provide resistance.
GBP/JPY holds lower grounds near 185.50 as it defends the previous day’s U-turn from the multi-year high after witnessing upbeat data from Japan, as well as a pullback in the Treasury bond yields, during the cautiously optimism markets on early Wednesday. However, the anxiety ahead of the August month Purchasing Managers Indexes (PMIs) for the UK prods the cross-currency pair’s further downside.
Japan’s first reading of the Jibun Bank Manufacturing PMI for August improves to 49.7 from 49.6, versus 49.5 expected, whereas the Services counterpart rose to 54.3 for the said month from 53.8 previous figures.
That said, the US 10-year Treasury bond yields keep the previous day’s retreat from the highest level since the late 2007 to 4.31% by the press time whereas the yields of Japanese Government Bonds (JGBs) struggle around the levels last seen in 2014.
It’s worth noting that the market’s cautious optimism, backed by likely improvement in the US-China ties and the anticipated rally in the Nikkei 225, also weigh on the GBP/JPY prices. Furthermore, the UK government’s record transfer to the Bank of England (BoE) to cover the losses made by the Quantitative Easing (QE) joins a jump in the British public debt to 95% to also exert downside pressure on the quote.
However, Bank of Japan (BoJ) Governor Kazuo Ueda refrained from discussing the details of Tuesday’s meeting with Japan Prime Minister Fumio Kishida, which he termed a ‘routine’ one and keeps the Yen buyers hopeful. However, BoJ’s Kuroda did mention that he explained BoJ’s July policy decision to PM.
Amid these plays, S&P500 Futures print mild gains and the stocks in the Asia-Pacific zone edge higher of late.
Moving on, the UK’s preliminary PMIs for August and geopolitical headlines will be crucial for fresh impulse. Above all, yield and this week’s Jackson Hole event are the key for a clear guide.
A daily closing below the two-week-old rising support line, now immediate resistance near 186.10, directs GBP/JPY bears toward July’s peak surrounding 184.00.
Technical Levels: Supports and Resistances
GBPJPY currently trading at 185.57 at the time of writing. Pair opened at 185.75 and is trading with a change of -0.10% % .
| Overview | Overview.1 | |
|---|---|---|
| 0 | Today last price | 185.57 |
| 1 | Today Daily Change | -0.18 |
| 2 | Today Daily Change % | -0.10% |
| 3 | Today daily open | 185.75 |
The pair remains strongly bullish on the daily timeframe. It trades above its 20 SMA @ 183.28, 50 SMA 182.39, 100 SMA @ 176.24 and 200 SMA @ 169.29.
| Trends | Trends.1 | |
|---|---|---|
| 0 | Daily SMA20 | 183.28 |
| 1 | Daily SMA50 | 182.39 |
| 2 | Daily SMA100 | 176.24 |
| 3 | Daily SMA200 | 169.29 |
The previous day high was 186.77 while the previous day low was 185.54. The daily 38.2% Fib levels comes at 186.01, expected to provide resistance. Similarly, the daily 61.8% fib level is at 186.3, expected to provide resistance.
Note the levels of interest below:
- Pivot support is noted at 185.27, 184.78, 184.03
- Pivot resistance is noted at 186.5, 187.26, 187.74
| Levels | Levels.1 |
|---|---|
| Previous Daily High | 186.77 |
| Previous Daily Low | 185.54 |
| Previous Weekly High | 186.47 |
| Previous Weekly Low | 183.46 |
| Previous Monthly High | 184.02 |
| Previous Monthly Low | 176.32 |
| Daily Fibonacci 38.2% | 186.01 |
| Daily Fibonacci 61.8% | 186.30 |
| Daily Pivot Point S1 | 185.27 |
| Daily Pivot Point S2 | 184.78 |
| Daily Pivot Point S3 | 184.03 |
| Daily Pivot Point R1 | 186.50 |
| Daily Pivot Point R2 | 187.26 |
| Daily Pivot Point R3 | 187.74 |
[/s2If]
Download Nehcap EAWe have two EAs that are operational on our LIVE accounts.
- EA-FIX: Check out the details here. Download EA-FIX . EA-FIX is a non-grid HFT scalper.
- EA-GROWTH: High quality low dd EA using trend grids. Download EA_GROWTHJoin Our Telegram Group
")


