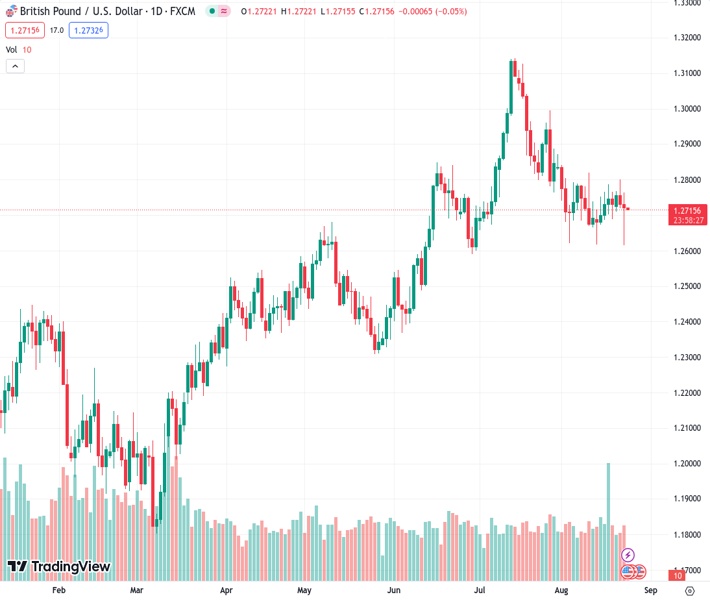
The GBP/USD pair, currently valued at 1.27245, received backing from the 100-day Simple Moving Average (SMA) as it reached a low point and eventually stabilized at 1.2720.
…
This is a premium post.
[s2If !current_user_can(access_s2member_level4)]Please register for FREE REGISTER to read full post below containing analysis. In case of any error or you think you are not able to read the full post below, please email us at support#nehcap.com [lwa][/s2If] [s2If current_user_can(access_s2member_level1)]
- GBP/USD found support at a low near the 100-day SMA and then settled at 1.2720.
The pair currently trades last at 1.27245.
The previous day high was 1.28 while the previous day low was 1.2718. The daily 38.2% Fib levels comes at 1.275, expected to provide resistance. Similarly, the daily 61.8% fib level is at 1.2769, expected to provide resistance.
The GBP/USD lost ground but managed to clear losses after finding support at a daily low of 1.2615, near the 100-day Simple Moving Average (SMA) and then settling above 1.2700. Weak economic activity from the US and the UK were the main reasons for the USD and GBP trading weak agains most of their rivals in Wednesday’s session.
The latest data on British Purchasing Managers’ Indices (PMIs) for August has raised concerns about the UK’s economy, as the manufacturing sector saw a significant decline, plummeting to 42.5, well within hostile territory. Additionally, the Services PMI also slipped below the 50 mark, registering at 48.7, and both figures came in lower than expected. Interestingly, these disappointing figures contrast with the Bank of England’s recent meeting, where they expressed that they no longer project a recession, so weak economic data raised concerns amongst the markets.
During the session, the British bond yield dived and contributed to the Pound being one of the worst performers on Wednesday. The 2-year yield retreated to 4.95%, down by 3.79%, while the 5 and 10-year rates declined to 4.47% and 4.45% seeing daily declines of 4.34% and 4.07%, respectively. According to the World Interest Rates Probabilities (WIRP) tool, markets still discount that the Bank of England (BoE) will raise rates to 6% in this tightening cycle.
PMI showed similar results on the US side, with the manufacturing index dropping higher than expected, but the Services PMI remained in expansion territory. In addition, US Treasury yields also saw sharp declines and tightening expectations on the Federal Reserve (Fed) eased somewhat. Focus now shifts to Jerome Powell’s speech on Friday, where investors will seek further clues on forward guidance.
The daily chart for the GBP/USD is neutral to bearish for the short term, suggesting that the bears are gaining momentum but still do not have an upperhand over the bulls for the short time.The Relative Strength Index (RSI) points southward below its midline, implying a bearish stance, while the Moving Average Convergence (MACD) displays lower red bars. Additionally, the pair is below the 20-day Simple Moving Average (SMA) but above the 100 and 200-day SMAs, pointing towards the prevailing strength of the bulls in the larger context. Trades should eye the convergence of the 20 and 100-day SMA’s for a potential bearish cross.
Support levels: 1.2700, 1.2635 (100-day SMA), 1.2615.
Resistance levels: 1.2740 (20-day SMA), 1.2790, 1.2830.
Technical Levels: Supports and Resistances
GBPUSD currently trading at 1.2716 at the time of writing. Pair opened at 1.2732 and is trading with a change of -0.13 % .
| Overview | Overview.1 | |
|---|---|---|
| 0 | Today last price | 1.2716 |
| 1 | Today Daily Change | -0.0016 |
| 2 | Today Daily Change % | -0.1300 |
| 3 | Today daily open | 1.2732 |
The pair is trading below its 20 Daily moving average @ 1.2754, below its 50 Daily moving average @ 1.2795 , above its 100 Daily moving average @ 1.2634 and above its 200 Daily moving average @ 1.2388
| Trends | Trends.1 | |
|---|---|---|
| 0 | Daily SMA20 | 1.2754 |
| 1 | Daily SMA50 | 1.2795 |
| 2 | Daily SMA100 | 1.2634 |
| 3 | Daily SMA200 | 1.2388 |
The previous day high was 1.28 while the previous day low was 1.2718. The daily 38.2% Fib levels comes at 1.275, expected to provide resistance. Similarly, the daily 61.8% fib level is at 1.2769, expected to provide resistance.
Note the levels of interest below:
- Pivot support is noted at 1.27, 1.2668, 1.2618
- Pivot resistance is noted at 1.2782, 1.2832, 1.2864
| Levels | Levels.1 |
|---|---|
| Previous Daily High | 1.2800 |
| Previous Daily Low | 1.2718 |
| Previous Weekly High | 1.2788 |
| Previous Weekly Low | 1.2617 |
| Previous Monthly High | 1.3142 |
| Previous Monthly Low | 1.2659 |
| Daily Fibonacci 38.2% | 1.2750 |
| Daily Fibonacci 61.8% | 1.2769 |
| Daily Pivot Point S1 | 1.2700 |
| Daily Pivot Point S2 | 1.2668 |
| Daily Pivot Point S3 | 1.2618 |
| Daily Pivot Point R1 | 1.2782 |
| Daily Pivot Point R2 | 1.2832 |
| Daily Pivot Point R3 | 1.2864 |
[/s2If]
Download Nehcap EAWe have two EAs that are operational on our LIVE accounts.
- EA-FIX: Check out the details here. Download EA-FIX . EA-FIX is a non-grid HFT scalper.
- EA-GROWTH: High quality low dd EA using trend grids. Download EA_GROWTHJoin Our Telegram Group
")


