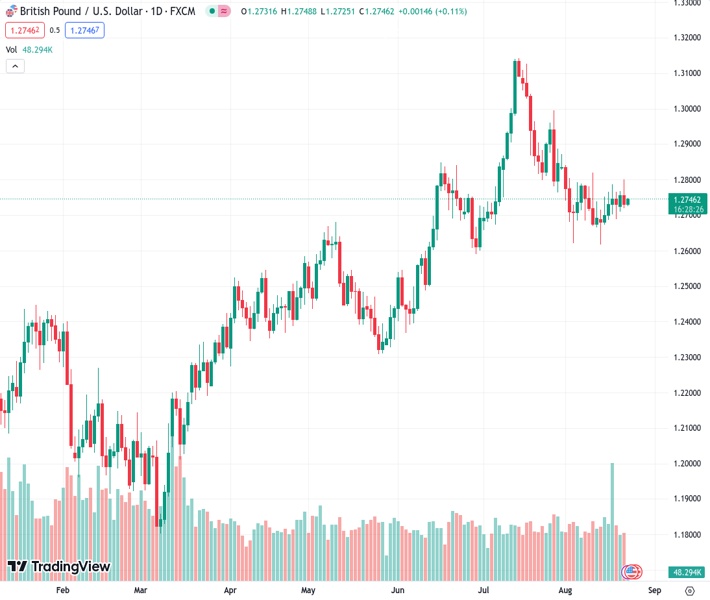
The GBP to USD exchange rate of 1.27471 strengthens as there is potential for the Bank of England to raise interest rates.
…
This is a premium post.
[s2If !current_user_can(access_s2member_level4)]Please register for FREE REGISTER to read full post below containing analysis. In case of any error or you think you are not able to read the full post below, please email us at support#nehcap.com [lwa][/s2If] [s2If current_user_can(access_s2member_level1)]
- GBP/USD experiences strength due to the possibility of interest rate hikes by the BoE.
The pair currently trades last at 1.27471.
The previous day high was 1.28 while the previous day low was 1.2718. The daily 38.2% Fib levels comes at 1.275, expected to provide resistance. Similarly, the daily 61.8% fib level is at 1.2769, expected to provide resistance.
GBP/USD trades higher around 23.6% Fibonacci retracement at 1.2740 at the time of writing during the Asian session on Wednesday. The pair gets support from the possibility of interest rate hikes in the September meeting by the Bank of England (BoE). Market participants turn cautious ahead of United Kingdom (UK) preliminary S&P Global/CIPS Composite PMIs for August, scheduled to be released later in the day.
The 55-day Exponential Moving Average (EMA) at 1.2728 acts as the immediate support, followed by the weekly low at 1.2710. A firm below the latter could open the doors for the GBP/USD sellers to navigate the region toward a monthly low at 1.2616.
On the upside, the GBP/USD pair could face a challenge around the 21-day EMA at 1.2755 as it appears to be a key barrier. An upside breakout could lead the pair to explore the region around the 1.2800 psychological level aligned to 38.2% Fibo at 1.2817.
The Moving Average Convergence Divergence (MACD) line suggests mixed sentiment of GBP/USD traders as it stays below the centerline but also shows convergence below the signal line. The 14-day Relative Strength Index (RSI) remains below 50, which suggests a bearish bias in the pair.
Technical Levels: Supports and Resistances
GBPUSD currently trading at 1.2749 at the time of writing. Pair opened at 1.2732 and is trading with a change of 0.13 % .
| Overview | Overview.1 | |
|---|---|---|
| 0 | Today last price | 1.2749 |
| 1 | Today Daily Change | 0.0017 |
| 2 | Today Daily Change % | 0.1300 |
| 3 | Today daily open | 1.2732 |
The pair is trading below its 20 Daily moving average @ 1.2754, below its 50 Daily moving average @ 1.2795 , above its 100 Daily moving average @ 1.2634 and above its 200 Daily moving average @ 1.2388
| Trends | Trends.1 | |
|---|---|---|
| 0 | Daily SMA20 | 1.2754 |
| 1 | Daily SMA50 | 1.2795 |
| 2 | Daily SMA100 | 1.2634 |
| 3 | Daily SMA200 | 1.2388 |
The previous day high was 1.28 while the previous day low was 1.2718. The daily 38.2% Fib levels comes at 1.275, expected to provide resistance. Similarly, the daily 61.8% fib level is at 1.2769, expected to provide resistance.
Note the levels of interest below:
- Pivot support is noted at 1.27, 1.2668, 1.2618
- Pivot resistance is noted at 1.2782, 1.2832, 1.2864
| Levels | Levels.1 |
|---|---|
| Previous Daily High | 1.2800 |
| Previous Daily Low | 1.2718 |
| Previous Weekly High | 1.2788 |
| Previous Weekly Low | 1.2617 |
| Previous Monthly High | 1.3142 |
| Previous Monthly Low | 1.2659 |
| Daily Fibonacci 38.2% | 1.2750 |
| Daily Fibonacci 61.8% | 1.2769 |
| Daily Pivot Point S1 | 1.2700 |
| Daily Pivot Point S2 | 1.2668 |
| Daily Pivot Point S3 | 1.2618 |
| Daily Pivot Point R1 | 1.2782 |
| Daily Pivot Point R2 | 1.2832 |
| Daily Pivot Point R3 | 1.2864 |
[/s2If]
Download Nehcap EAWe have two EAs that are operational on our LIVE accounts.
- EA-FIX: Check out the details here. Download EA-FIX . EA-FIX is a non-grid HFT scalper.
- EA-GROWTH: High quality low dd EA using trend grids. Download EA_GROWTHJoin Our Telegram Group
")


