The AUDUSD currency pair remains stable at a value of 0.64281, awaiting the release of the US PMI data.
…
This is a premium post.
[s2If !current_user_can(access_s2member_level4)]Please register for FREE REGISTER to read full post below containing analysis. In case of any error or you think you are not able to read the full post below, please email us at support#nehcap.com [lwa][/s2If] [s2If current_user_can(access_s2member_level1)]
- AUD/USD treads water ahead of the US PMI data release.
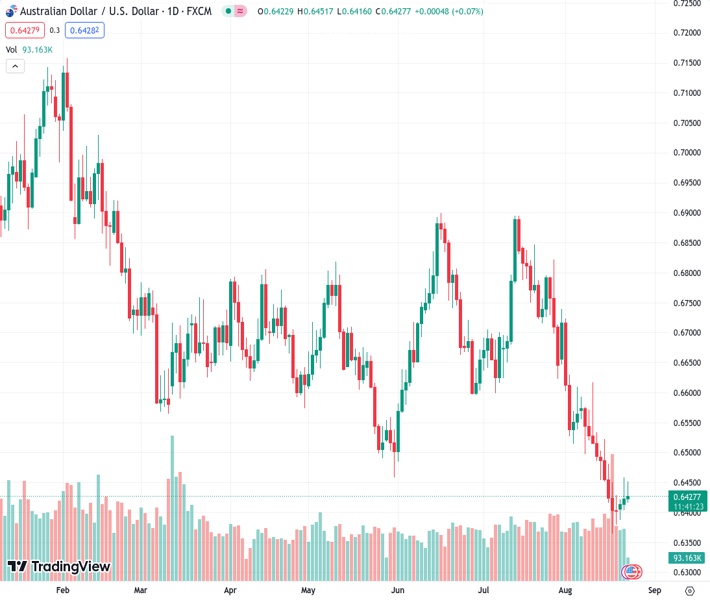
The pair currently trades last at 0.64281.
The previous day high was 0.6458 while the previous day low was 0.6404. The daily 38.2% Fib levels comes at 0.6437, expected to provide resistance. Similarly, the daily 61.8% fib level is at 0.6424, expected to provide support.
AUD/USD trades higher around 0.6430 at the time of writing during the European session, treading waters to continue the winning streak that began on Monday. Investors await the release of United States (US) PMI data later in the North American session, seeking more cues on the economic situation in the US.
The nine-day Exponential Moving Average (EMA) at 0.6446 acts as the immediate resistance, following the 23.6% Fibonacci retracement at 0.6489.
A breakout above that level could open the doors for the AUD/USD buyers to explore the region around the 21-day EMA at 0.6518, followed by the 38.2% Fibo at 0.6566.
On the downside, the 0.6400 psychological level appears to be the key support, following the region around the monthly low at 0.6364.
The Moving Average Convergence Divergence (MACD) line suggests a tepid momentum, reflecting the mixed sentiment of AUD/USD traders as it stays below the centerline but shows convergence below the signal line. The 14-day Relative Strength Index (RSI) remains below 50, which suggests a bearish bias in the pair.
Technical Levels: Supports and Resistances
AUDUSD currently trading at 0.643 at the time of writing. Pair opened at 0.6423 and is trading with a change of 0.11 % .
| Overview | Overview.1 | |
|---|---|---|
| 0 | Today last price | 0.6430 |
| 1 | Today Daily Change | 0.0007 |
| 2 | Today Daily Change % | 0.1100 |
| 3 | Today daily open | 0.6423 |
The pair remains strongly bearish on the daily time frame. It trades below the 20 SMA @ 0.6539, 50 SMA 0.6662, 100 SMA @ 0.6662 and 200 SMA @ 0.6731.
| Trends | Trends.1 | |
|---|---|---|
| 0 | Daily SMA20 | 0.6539 |
| 1 | Daily SMA50 | 0.6662 |
| 2 | Daily SMA100 | 0.6662 |
| 3 | Daily SMA200 | 0.6731 |
The previous day high was 0.6458 while the previous day low was 0.6404. The daily 38.2% Fib levels comes at 0.6437, expected to provide resistance. Similarly, the daily 61.8% fib level is at 0.6424, expected to provide support.
Note the levels of interest below:
- Pivot support is noted at 0.6398, 0.6374, 0.6344
- Pivot resistance is noted at 0.6453, 0.6482, 0.6507
| Levels | Levels.1 |
|---|---|
| Previous Daily High | 0.6458 |
| Previous Daily Low | 0.6404 |
| Previous Weekly High | 0.6522 |
| Previous Weekly Low | 0.6364 |
| Previous Monthly High | 0.6895 |
| Previous Monthly Low | 0.6599 |
| Daily Fibonacci 38.2% | 0.6437 |
| Daily Fibonacci 61.8% | 0.6424 |
| Daily Pivot Point S1 | 0.6398 |
| Daily Pivot Point S2 | 0.6374 |
| Daily Pivot Point S3 | 0.6344 |
| Daily Pivot Point R1 | 0.6453 |
| Daily Pivot Point R2 | 0.6482 |
| Daily Pivot Point R3 | 0.6507 |
[/s2If]
Download Nehcap EAWe have two EAs that are operational on our LIVE accounts.
- EA-FIX: Check out the details here. Download EA-FIX . EA-FIX is a non-grid HFT scalper.
- EA-GROWTH: High quality low dd EA using trend grids. Download EA_GROWTHJoin Our Telegram Group
")


