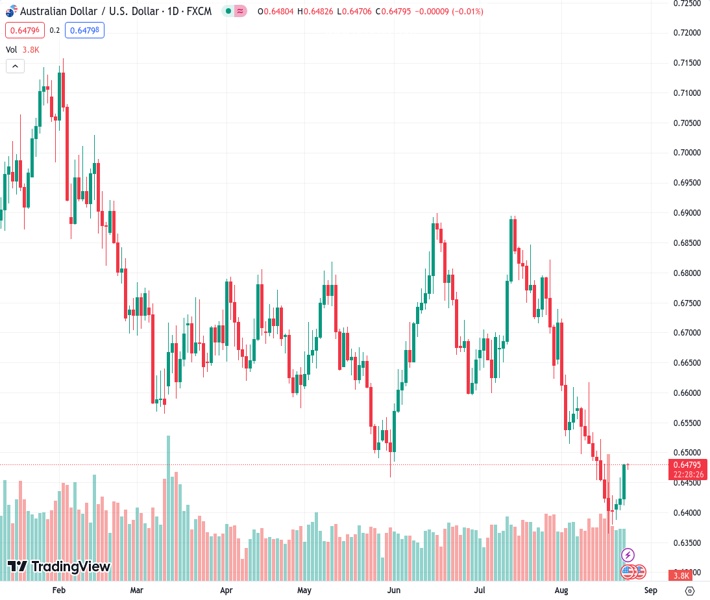
The AUDUSD currency pair experienced its biggest increase in August following a decline in yields and a positive shift in sentiment, as investors looked forward to upcoming US data releases and the Jackson Hole event.
…
This is a premium post.
[s2If !current_user_can(access_s2member_level4)]Please register for FREE REGISTER to read full post below containing analysis. In case of any error or you think you are not able to read the full post below, please email us at support#nehcap.com [lwa][/s2If] [s2If current_user_can(access_s2member_level1)]
- AUD/USD jumps the most in August after yields slump, sentiment improves ahead of more US data, Jackson Hole event.
The pair currently trades last at 0.64797.
The previous day high was 0.6458 while the previous day low was 0.6404. The daily 38.2% Fib levels comes at 0.6437, expected to provide support. Similarly, the daily 61.8% fib level is at 0.6424, expected to provide support.
AUD/USD buyers take a breather while making rounds to 0.6480, after rising the most in three weeks the previous day. In doing so, the Aussie pair portrays the market’s cautious mood ahead of the top-tier catalysts after cheering the risk-on mood and downbeat US Treasury bond yields while paying a little heed to the disappointing Australia PMIs.
The mostly downbeat Purchasing Managers Index (PMI) for August from the top-tier economies restored the market’s previous concerns about witnessing a sooner end to the hawkish monetary policy cycle at the major central banks. Also favoring the Aussie pair were headlines suggesting the improving ties between the US and China, as well as the upbeat performance of equities and a slump in the US Treasury bond yields, which in turn drowned the US Dollar.
On Wednesday, preliminary readings of the US S&P Global Manufacturing PMI dropped to 47.0 for August from 49.0 versus 49.3 market forecasts whereas the Services counterpart also edged lower to 51.0, compared to 52.2 expected and 52.3 marked the previous month. With this, the S&P Global Composite PMI for the US eased to 50.4 for the said month from 52.0 prior and the analysts’ estimations. Further, US New Home Sales change rose to 4.4% MoM for July versus -2.5% previous readings.
At home, Australia’s preliminary readings of the S&P Global Manufacturing PMI eased to 49.4 from 49.6 expected and prior while the Services counterpart dropped to 46.7 from 47.9 market forecasts and previous readings. With this, the first reading of the S&P Global Composite PMI weakens to 47.1 for the said month from 48.2 marked in July.
A likely improvement in the US–China ties, is due to US Commerce Secretary Gina Raimondo’s visit to Beijing, scheduled for next week. On the same line are the early-week news suggesting the US removal of 27 Chinese entities from its Unverified List, lifting sanctions from those entities and flagging hopes of improving diplomatic ties.
Amid these plays, the US Dollar Index (DXY) retreated from the 11-week high and underpinned the AUD/USD run-up while the Wall Street benchmarks also closed in the positive territory to offer a helping hand to the buyers. More importantly, the US 10-year Treasury bond yields flashed the biggest daily fall in three weeks to portray the market’s optimism and propel the Aussie pair.
Looking forward, a two-day-long annual Jackson Hole Symposium organized by the Kansas Federal Reserve (Fed) gains the AUD/USD trader’s attention, the US Durable Goods Orders and weekly Jobless Claims could offer more directions for a precise prediction of the pair. Above all, Friday’s speech of Fed Chair Jerome Powell will be closely watched as the recent US data and interest rate futures point towards the US central bank’s policy pivot but Fed’s Powell isn’t known for his dovish style.
A daily closing beyond May’s top and a one-month-old descending resistance line, respectively around 0.6460 and 0.6400, keeps the AUD/USD buyers to aim for a downward-sloping trend line stretched from July 14, close to 0.6515.
Technical Levels: Supports and Resistances
AUDUSD currently trading at 0.6482 at the time of writing. Pair opened at 0.6423 and is trading with a change of 0.92% % .
| Overview | Overview.1 | |
|---|---|---|
| 0 | Today last price | 0.6482 |
| 1 | Today Daily Change | 0.0059 |
| 2 | Today Daily Change % | 0.92% |
| 3 | Today daily open | 0.6423 |
The pair remains strongly bearish on the daily time frame. It trades below the 20 SMA @ 0.6539, 50 SMA 0.6662, 100 SMA @ 0.6662 and 200 SMA @ 0.6731.
| Trends | Trends.1 | |
|---|---|---|
| 0 | Daily SMA20 | 0.6539 |
| 1 | Daily SMA50 | 0.6662 |
| 2 | Daily SMA100 | 0.6662 |
| 3 | Daily SMA200 | 0.6731 |
The previous day high was 0.6458 while the previous day low was 0.6404. The daily 38.2% Fib levels comes at 0.6437, expected to provide support. Similarly, the daily 61.8% fib level is at 0.6424, expected to provide support.
Note the levels of interest below:
- Pivot support is noted at 0.6398, 0.6374, 0.6344
- Pivot resistance is noted at 0.6453, 0.6482, 0.6507
| Levels | Levels.1 |
|---|---|
| Previous Daily High | 0.6458 |
| Previous Daily Low | 0.6404 |
| Previous Weekly High | 0.6522 |
| Previous Weekly Low | 0.6364 |
| Previous Monthly High | 0.6895 |
| Previous Monthly Low | 0.6599 |
| Daily Fibonacci 38.2% | 0.6437 |
| Daily Fibonacci 61.8% | 0.6424 |
| Daily Pivot Point S1 | 0.6398 |
| Daily Pivot Point S2 | 0.6374 |
| Daily Pivot Point S3 | 0.6344 |
| Daily Pivot Point R1 | 0.6453 |
| Daily Pivot Point R2 | 0.6482 |
| Daily Pivot Point R3 | 0.6507 |
[/s2If]
Download Nehcap EAWe have two EAs that are operational on our LIVE accounts.
- EA-FIX: Check out the details here. Download EA-FIX . EA-FIX is a non-grid HFT scalper.
- EA-GROWTH: High quality low dd EA using trend grids. Download EA_GROWTHJoin Our Telegram Group
")


