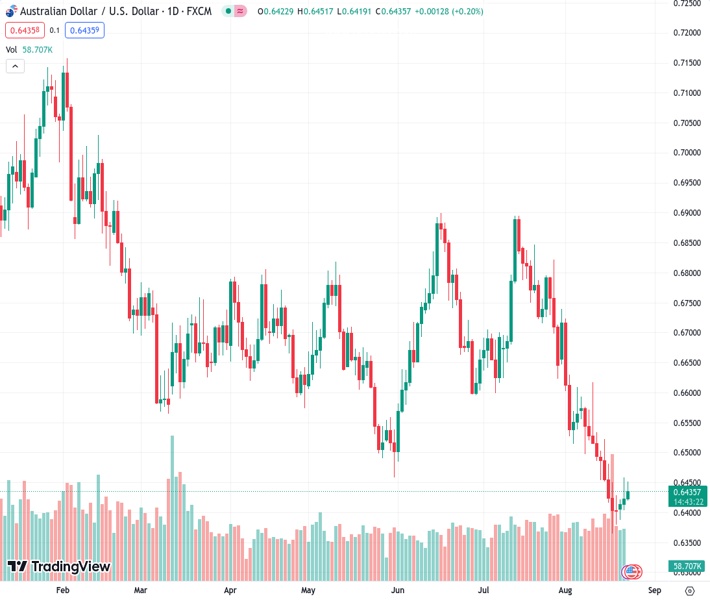
The AUDUSD currency pair, currently at a value of 0.64374, has increased slightly as it continues its four-day pattern of gains. This movement counters the earlier downward correction from its highest point of the day.
…
This is a premium post.
[s2If !current_user_can(access_s2member_level4)]Please register for FREE REGISTER to read full post below containing analysis. In case of any error or you think you are not able to read the full post below, please email us at support#nehcap.com [lwa][/s2If] [s2If current_user_can(access_s2member_level1)]
- AUD/USD edges higher amid four-day winning streak, reverses pullback from intraday top of late.
The pair currently trades last at 0.64374.
The previous day high was 0.6458 while the previous day low was 0.6404. The daily 38.2% Fib levels comes at 0.6437, expected to provide support. Similarly, the daily 61.8% fib level is at 0.6424, expected to provide support.
AUD/USD stays on the front foot for the fourth consecutive day, despite struggling of late, as market players cheer the downbeat US Dollar amid early Wednesday morning in Europe. With this, the Aussie pair adds 0.30% intraday gains to print the 0.6450 level by the press time.
Among the key catalysts, the market’s cautious optimism and a pullback in the US Treasury bond yields gain major attention. It’s worth noting, however, that the downbeat prints of Australia’s preliminary readings of the S&P Global PMIs for August cap the AUD/USD pair’s immediate upside.
That said, the headlines suggest a likely improvement in the US–China ties, due to US Commerce Secretary Gina Raimondo’s visit to Beijing, scheduled for next week. On the same line are the early-week news suggesting the US removal of 27 Chinese entities from its Unverified List, lifting sanctions from those entities and flagging hopes of improving diplomatic ties.
On the other hand, mixed US data and Fed talks also prod the DXY bulls as market participants don’t expect the hawkish appearance of Fed Chair Jerome Powell at this week’s annual Jackson Hole event. That said, the US flashed slight improvement in the US Existing Home Sales for July and the Richmond Fed Manufacturing Index for August, which in turn should entertain the AUD/USD sellers. However, hawkish statements from Federal Reserve Bank of Richmond President Thomas Barkin put a floor under the pair.
While portraying the mood, the US 10-year Treasury bond yields keep the previous day’s retreat from the highest level since late 2007 to 4.31% whereas S&P500 Futures rise 0.25% intraday to regain 4,410 level after reversing from a one-week high the previous day. Further, the US Dollar Index (DXY) retreats from the 10-week high marked the previous day to around 103.50 at the latest.
Looking forward, the preliminary readings of the August month Purchasing Managers Indexes (PMIs) and Existing Home Sales for July for the US will entertain the AUD/USD pair traders. However, top-tier central bankers’ speeches at the annual Jackson Hole Symposium event, scheduled for August 24–26, will be crucial for clear directions.
The nearly oversold RSI (14) on the daily chart joins the weekly ascending support line, close to 0.6405, to inspire AUD/USD buyers in approaching May’s low of around 0.6460. However, a downward-sloping resistance line from late June, close to 0.6480 at the latest, can challenge the Aussie pair’s further upside.
Technical Levels: Supports and Resistances
AUDUSD currently trading at 0.6441 at the time of writing. Pair opened at 0.6423 and is trading with a change of 0.28% % .
| Overview | Overview.1 | |
|---|---|---|
| 0 | Today last price | 0.6441 |
| 1 | Today Daily Change | 0.0018 |
| 2 | Today Daily Change % | 0.28% |
| 3 | Today daily open | 0.6423 |
The pair remains strongly bearish on the daily time frame. It trades below the 20 SMA @ 0.6539, 50 SMA 0.6662, 100 SMA @ 0.6662 and 200 SMA @ 0.6731.
| Trends | Trends.1 | |
|---|---|---|
| 0 | Daily SMA20 | 0.6539 |
| 1 | Daily SMA50 | 0.6662 |
| 2 | Daily SMA100 | 0.6662 |
| 3 | Daily SMA200 | 0.6731 |
The previous day high was 0.6458 while the previous day low was 0.6404. The daily 38.2% Fib levels comes at 0.6437, expected to provide support. Similarly, the daily 61.8% fib level is at 0.6424, expected to provide support.
Note the levels of interest below:
- Pivot support is noted at 0.6398, 0.6374, 0.6344
- Pivot resistance is noted at 0.6453, 0.6482, 0.6507
| Levels | Levels.1 |
|---|---|
| Previous Daily High | 0.6458 |
| Previous Daily Low | 0.6404 |
| Previous Weekly High | 0.6522 |
| Previous Weekly Low | 0.6364 |
| Previous Monthly High | 0.6895 |
| Previous Monthly Low | 0.6599 |
| Daily Fibonacci 38.2% | 0.6437 |
| Daily Fibonacci 61.8% | 0.6424 |
| Daily Pivot Point S1 | 0.6398 |
| Daily Pivot Point S2 | 0.6374 |
| Daily Pivot Point S3 | 0.6344 |
| Daily Pivot Point R1 | 0.6453 |
| Daily Pivot Point R2 | 0.6482 |
| Daily Pivot Point R3 | 0.6507 |
[/s2If]
Download Nehcap EAWe have two EAs that are operational on our LIVE accounts.
- EA-FIX: Check out the details here. Download EA-FIX . EA-FIX is a non-grid HFT scalper.
- EA-GROWTH: High quality low dd EA using trend grids. Download EA_GROWTHJoin Our Telegram Group
")


