Silver’s price rises for the fifth consecutive day and reaches a nearly three-week peak on Wednesday.
…
This is a premium post.
[s2If !current_user_can(access_s2member_level4)]Please register for FREE REGISTER to read full post below containing analysis. In case of any error or you think you are not able to read the full post below, please email us at support#nehcap.com [lwa][/s2If] [s2If current_user_can(access_s2member_level1)]
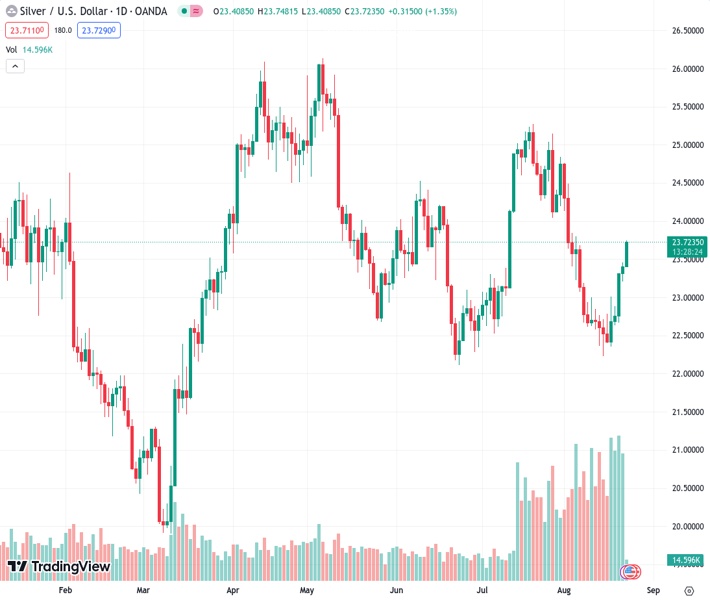
- Silver scales higher for the fifth straight day and jumps to a nearly three-week high on Wednesday.
The pair currently trades last at 23.728.
The previous day high was 23.45 while the previous day low was 23.21. The daily 38.2% Fib levels comes at 23.36, expected to provide support. Similarly, the daily 61.8% fib level is at 23.3, expected to provide support.
Silver prolongs its recent goodish rebound from the $22.20 area, or a nearly two-month low touched last week and gains strong follow-through traction for the fifth successive day on Wednesday. The momentum lifts the white metal to a two-and-half-week high during the early European session, closer to the $23.75 confluence barrier.
The said area comprises the 200-period Simple Moving Average (SMA) on the 4-hour chart, an ascending trend-line support breakpoint and the 50% Fibonacci retracement level of the July-August downfall. A sustained strength beyond will be seen as a fresh trigger for bullish traders. That said, the Relative Strength Index (RSI) on hourly charts is flashing overbought conditions and makes it prudent to wait for some intraday consolidation or a modest pullback before positioning for any further gains.
Technical indicators on the daily chart, however, have just started gaining positive traction and suggest that the path of least resistance for the XAG/USD is to the upside. Hence, any meaningful dip could attract fresh buyers and remain limited near the $23.40 region, or the 38.2% Fibo. level. The next relevant support is pegged near the $23.25 region, below which a fresh bout of technical selling could accelerate the fall and drag the XAG/USD towards the 23.6% Fibo. level, around the $23.00 mark.
Bulls, meanwhile, might wait for a convincing breakout through the $23.75 confluence, above which the XAG/USD could aim to reclaim the $24.00 round figure, which coincides with the 61.8% Fibo. level. Some follow-through buying might then lift the white metal to its next relevant hurdle near the $24.55-$24.60 region en route to the $25.00 psychological mark and the July monthly swing high, around the $25.25 zone.
Technical Levels: Supports and Resistances
XAGUSD currently trading at 23.69 at the time of writing. Pair opened at 23.41 and is trading with a change of 1.2 % .
| Overview | Overview.1 | |
|---|---|---|
| 0 | Today last price | 23.69 |
| 1 | Today Daily Change | 0.28 |
| 2 | Today Daily Change % | 1.20 |
| 3 | Today daily open | 23.41 |
The pair is trading above its 20 Daily moving average @ 23.35, above its 50 Daily moving average @ 23.51 , below its 100 Daily moving average @ 24.0 and above its 200 Daily moving average @ 23.31
| Trends | Trends.1 | |
|---|---|---|
| 0 | Daily SMA20 | 23.35 |
| 1 | Daily SMA50 | 23.51 |
| 2 | Daily SMA100 | 24.00 |
| 3 | Daily SMA200 | 23.31 |
The previous day high was 23.45 while the previous day low was 23.21. The daily 38.2% Fib levels comes at 23.36, expected to provide support. Similarly, the daily 61.8% fib level is at 23.3, expected to provide support.
Note the levels of interest below:
- Pivot support is noted at 23.26, 23.11, 23.02
- Pivot resistance is noted at 23.51, 23.6, 23.75
| Levels | Levels.1 |
|---|---|
| Previous Daily High | 23.45 |
| Previous Daily Low | 23.21 |
| Previous Weekly High | 23.01 |
| Previous Weekly Low | 22.23 |
| Previous Monthly High | 25.27 |
| Previous Monthly Low | 22.52 |
| Daily Fibonacci 38.2% | 23.36 |
| Daily Fibonacci 61.8% | 23.30 |
| Daily Pivot Point S1 | 23.26 |
| Daily Pivot Point S2 | 23.11 |
| Daily Pivot Point S3 | 23.02 |
| Daily Pivot Point R1 | 23.51 |
| Daily Pivot Point R2 | 23.60 |
| Daily Pivot Point R3 | 23.75 |
[/s2If]
Download Nehcap EAWe have two EAs that are operational on our LIVE accounts.
- EA-FIX: Check out the details here. Download EA-FIX . EA-FIX is a non-grid HFT scalper.
- EA-GROWTH: High quality low dd EA using trend grids. Download EA_GROWTHJoin Our Telegram Group
")


