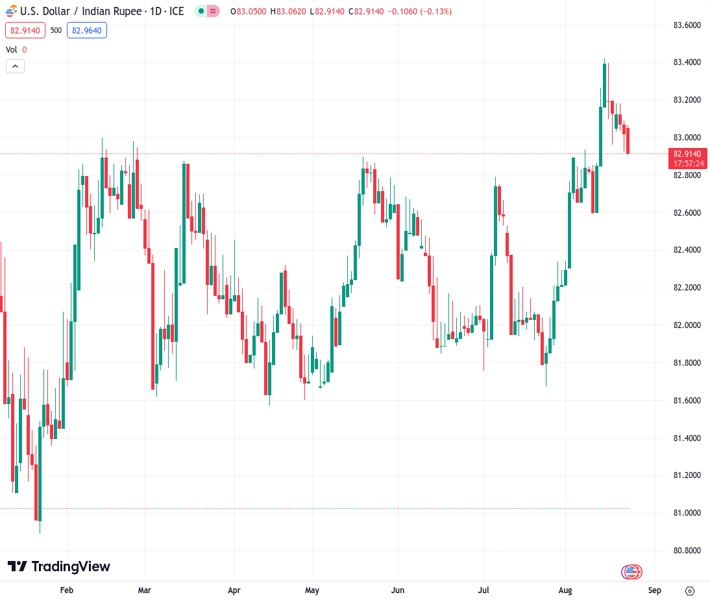
On Wednesday, the USDINR exchange rate of 82.9350 continues to decline for the third consecutive day.
…
This is a premium post.
[s2If !current_user_can(access_s2member_level4)]Please register for FREE REGISTER to read full post below containing analysis. In case of any error or you think you are not able to read the full post below, please email us at support#nehcap.com [lwa][/s2If] [s2If current_user_can(access_s2member_level1)]
- USD/INR trades with a negative bias for the third successive day on Wednesday.
The pair currently trades last at 82.9350.
The previous day high was 83.1426 while the previous day low was 82.9132. The daily 38.2% Fib levels comes at 83.0008, expected to provide resistance. Similarly, the daily 61.8% fib level is at 83.055, expected to provide resistance.
The USD/INR pair struggles to capitalize on the previous day’s late rebound from over a one-week low and trades with a negative bias for the third successive day on Wednesday. This also marks the fifth day of a downtick in the previous six, though lacks bearish conviction. Moreover, spot prices have been showing some resilience below the 83.00 resistance breakpoint, now turned support, warranting some caution before positioning for an extension of the recent pullback from the record higher touched last week.
The US Dollar (USD) eases from its highest level since July 12 in the wake of a modest decline in the US Treasury bond yields and turns out to be a key factor acting as a headwind for the USD/INR pair. Apart from this, a goodish pickup in the US equity futures further holds back traders from placing fresh bullish bets around the safe-haven USD. That said, firming expectations that the Federal Reserve (Fed) will stick to its hawkish stance should limit any meaningful slide for the US bond yields. This, along with concerns about the worsening economic conditions in China, might lend support to the Greenback.
From a technical perspective, the USD/INR pair now seems to have found acceptance below the 23.6% Fibonacci retracement level of the July-August rally. This supports prospects for a further slide towards 38.2% Fibo. level, around the 82.85-82.80 region, en route to the 82.60 area, or the 50% Fibo. level. A convincing break below, however, might prompt some technical selling and pave the way for some meaningful downfall. Meanwhile, oscillators on the daily chart are holding comfortably in the positive territory and support prospects for the emergence of some dip-buying at lower levels.
Bulls, however, might now wait for some follow-through buying beyond the 83.40 area, or the record high before positioning for a further near-term appreciating move towards the 84.00 round-figure mark.
Technical Levels: Supports and Resistances
USDINR currently trading at 83.0225 at the time of writing. Pair opened at 83.0935 and is trading with a change of -0.09 % .
| Overview | Overview.1 | |
|---|---|---|
| 0 | Today last price | 83.0225 |
| 1 | Today Daily Change | -0.0710 |
| 2 | Today Daily Change % | -0.0900 |
| 3 | Today daily open | 83.0935 |
The pair remains strongly bullish on the daily timeframe. It trades above its 20 SMA @ 82.8209, 50 SMA 82.389, 100 SMA @ 82.2947 and 200 SMA @ 82.2468.
| Trends | Trends.1 | |
|---|---|---|
| 0 | Daily SMA20 | 82.8209 |
| 1 | Daily SMA50 | 82.3890 |
| 2 | Daily SMA100 | 82.2947 |
| 3 | Daily SMA200 | 82.2468 |
The previous day high was 83.1426 while the previous day low was 82.9132. The daily 38.2% Fib levels comes at 83.0008, expected to provide resistance. Similarly, the daily 61.8% fib level is at 83.055, expected to provide resistance.
Note the levels of interest below:
- Pivot support is noted at 82.957, 82.8205, 82.7277
- Pivot resistance is noted at 83.1863, 83.2791, 83.4156
| Levels | Levels.1 |
|---|---|
| Previous Daily High | 83.1426 |
| Previous Daily Low | 82.9132 |
| Previous Weekly High | 83.5505 |
| Previous Weekly Low | 82.8946 |
| Previous Monthly High | 82.8334 |
| Previous Monthly Low | 81.6588 |
| Daily Fibonacci 38.2% | 83.0008 |
| Daily Fibonacci 61.8% | 83.0550 |
| Daily Pivot Point S1 | 82.9570 |
| Daily Pivot Point S2 | 82.8205 |
| Daily Pivot Point S3 | 82.7277 |
| Daily Pivot Point R1 | 83.1863 |
| Daily Pivot Point R2 | 83.2791 |
| Daily Pivot Point R3 | 83.4156 |
[/s2If]
Download Nehcap EAWe have two EAs that are operational on our LIVE accounts.
- EA-FIX: Check out the details here. Download EA-FIX . EA-FIX is a non-grid HFT scalper.
- EA-GROWTH: High quality low dd EA using trend grids. Download EA_GROWTHJoin Our Telegram Group
")


