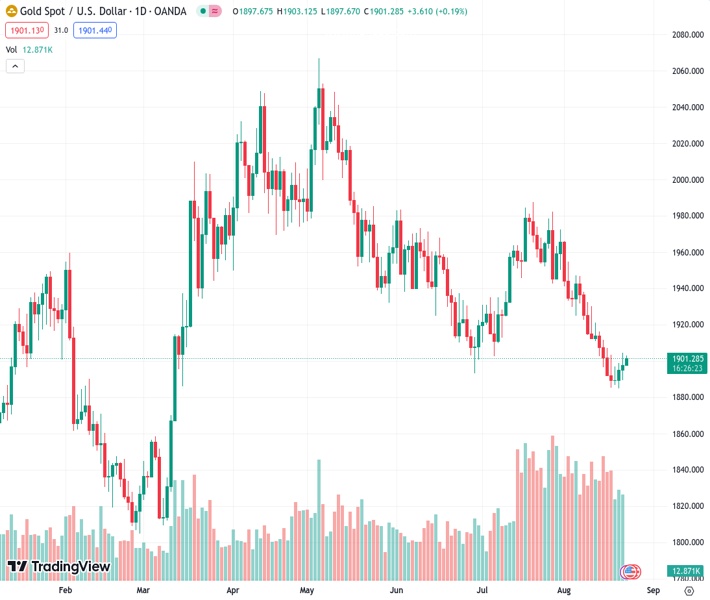
On Wednesday, the price of gold, currently at 1,901.09 in the XAUUSD market, continues to consistently increase for the third consecutive day.
…
This is a premium post.
[s2If !current_user_can(access_s2member_level4)]Please register for FREE REGISTER to read full post below containing analysis. In case of any error or you think you are not able to read the full post below, please email us at support#nehcap.com [lwa][/s2If] [s2If current_user_can(access_s2member_level1)]
- Gold price gains positive traction for the third successive day on Wednesday.
The pair currently trades last at 1901.09.
The previous day high was 1904.51 while the previous day low was 1889.14. The daily 38.2% Fib levels comes at 1898.64, expected to provide support. Similarly, the daily 61.8% fib level is at 1895.01, expected to provide support.
Gold price attracts some dip-buying on Wednesday and stalls the overnight modest pullback from the $1,904-$1,905 region, or a multi-day peak. The XAU/USD climbs back above the $1,900 mark during the Asian session, though any meaningful appreciating move remains elusive in the wake of firming expectations that the Federal Reserve (Fed) will stick to its hawkish stance.
In fact, market participants now seem convinced that the Fed will keep interest rates higher for longer and have been pricing in the possibility of one more 25 basis points (bps) lift-off by the end of this year. This led to the recent rise in the US Treasury bond yields and dragged the non-yielding Gold price to its lowest level since mid-March, around the $1,885 area earlier this week. That said, a combination of supporting facts assists the XAU/USD to stage a modest recovery and gain some positive traction for the third successive day.
The yield on the benchmark 10-year US government bond retreats after surging to a nearly 16-year high on Tuesday and prompts some profit-taking around the US Dollar (USD). A softer Greenback tends to benefit the US Dollar-denominated Gold price. Apart from this, concerns about the worsening economic conditions in China lend additional support to the safe-haven precious metal and remain supportive of the ongoing recovery move. Traders, however, might refrain from placing aggressive bets ahead of the Jackson Hole Symposium.
Investors will closely scrutinize comments by Fed Chair Jerome Powell for fresh cues about the future rate-hike path, against the backdrop of growing acceptance of a pause in September. This, in turn, will play a key role in influencing the near-term USD price dynamics and determine the next leg of a directional move for the Gold price. Heading into the key event risk, the flash PMI prints might provide an insight into the global economic health and contribute to producing short-term trading opportunities around the XAU/USD.
The aforementioned fundamental backdrop, meanwhile, warrants some caution for aggressive bullish traders. Hence, it will be prudent to wait for a sustained strength back above the technically significant 200-day Simple Moving Average (SMA), around the $1,907 area, before confirming that the Gold price has bottomed out.
Technical Levels: Supports and Resistances
XAUUSD currently trading at 1901.25 at the time of writing. Pair opened at 1897.48 and is trading with a change of 0.2 % .
| Overview | Overview.1 | |
|---|---|---|
| 0 | Today last price | 1901.25 |
| 1 | Today Daily Change | 3.77 |
| 2 | Today Daily Change % | 0.20 |
| 3 | Today daily open | 1897.48 |
The pair remains strongly bearish on the daily time frame. It trades below the 20 SMA @ 1923.65, 50 SMA 1932.96, 100 SMA @ 1961.05 and 200 SMA @ 1907.98.
| Trends | Trends.1 | |
|---|---|---|
| 0 | Daily SMA20 | 1923.65 |
| 1 | Daily SMA50 | 1932.96 |
| 2 | Daily SMA100 | 1961.05 |
| 3 | Daily SMA200 | 1907.98 |
The previous day high was 1904.51 while the previous day low was 1889.14. The daily 38.2% Fib levels comes at 1898.64, expected to provide support. Similarly, the daily 61.8% fib level is at 1895.01, expected to provide support.
Note the levels of interest below:
- Pivot support is noted at 1889.58, 1881.67, 1874.21
- Pivot resistance is noted at 1904.95, 1912.41, 1920.32
| Levels | Levels.1 |
|---|---|
| Previous Daily High | 1904.51 |
| Previous Daily Low | 1889.14 |
| Previous Weekly High | 1916.29 |
| Previous Weekly Low | 1885.13 |
| Previous Monthly High | 1987.54 |
| Previous Monthly Low | 1902.77 |
| Daily Fibonacci 38.2% | 1898.64 |
| Daily Fibonacci 61.8% | 1895.01 |
| Daily Pivot Point S1 | 1889.58 |
| Daily Pivot Point S2 | 1881.67 |
| Daily Pivot Point S3 | 1874.21 |
| Daily Pivot Point R1 | 1904.95 |
| Daily Pivot Point R2 | 1912.41 |
| Daily Pivot Point R3 | 1920.32 |
[/s2If]
Download Nehcap EAWe have two EAs that are operational on our LIVE accounts.
- EA-FIX: Check out the details here. Download EA-FIX . EA-FIX is a non-grid HFT scalper.
- EA-GROWTH: High quality low dd EA using trend grids. Download EA_GROWTHJoin Our Telegram Group
")


