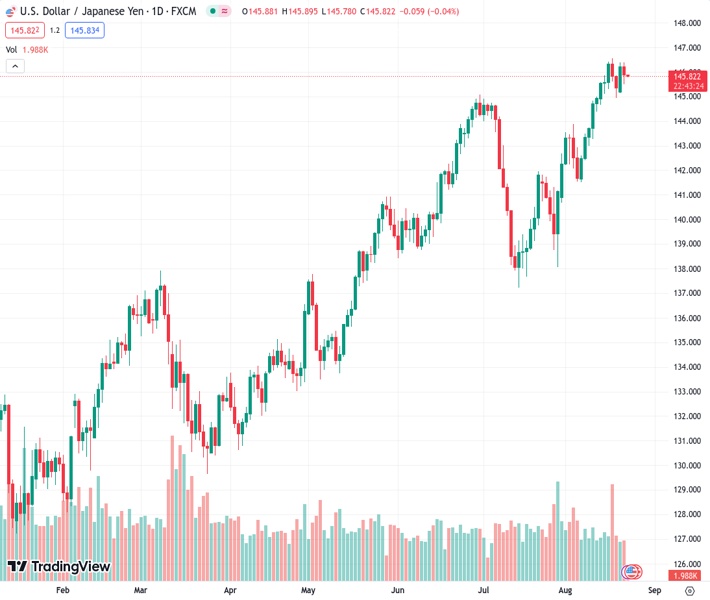
The USDJPY currency pair ended the session around the 145.80 level, indicating that the bulls were beginning to show signs of fatigue.
…
This is a premium post.
[s2If !current_user_can(access_s2member_level4)]Please register for FREE REGISTER to read full post below containing analysis. In case of any error or you think you are not able to read the full post below, please email us at support#nehcap.com [lwa][/s2If] [s2If current_user_can(access_s2member_level1)]
- USD/JPY closed near the 145.80 area as bulls showed signs of exhaustion.
The pair currently trades last at 145.817.
The previous day high was 146.4 while the previous day low was 145.15. The daily 38.2% Fib levels comes at 145.92, expected to provide resistance. Similarly, the daily 61.8% fib level is at 145.63, expected to provide support.
In Tuesday’s session, the JPY traded strongly against most of its rivals, mainly driven by the 10-year Japanese bond yield rise, which rose to its highest level since 2014, past 0.60%. On the USD side, the Greenback traded mixed against its rivals, while investors remain cautios ahead of the Jackson Hole Symposium kick-off on Thursday, followed by Jerome Powell’s speech on Friday to continue placing their bets regarding the next Federal Reserve (Fed) decisions.
On Wednesday, investors will pay close attention to the S&P Global PMIs from the US from August, which will also help investors model their expectations in relation to the US economic outlook. During the early Asian session, the Jibun Bank will release the Japanese PMIs from the same month.
Regarding the Federal Reserve (Fed) decisions, markets continue to bet to a no-hike in the September meeting and place nearly 40% bets of a 25 basis point (bps) hike on the November meeting. On the Bank of Japan (BoJ) side, the rise in the Japanese yields indicates that markets are hoping for a tweak, but as for now, the bank hasn’t given any signals about leaving its monetary policy.
The USD/JPY suggests a neutral to bearish technical outlook on the daily chart as bullish momentum wanes. The Relative Strength Index (RSI) indicates a negative slope above its midline, and the Moving Average Convergence Divergence (MACD) displays fading green bars. .On the other hand, the pair is above the 20,100,200-day Simple Moving Average (SMAs), suggesting that the bulls are firmly in control of the bigger picture.
Support levels: 145.00. 144.50, 143.97 (20-day SMA)
Resistance levels: 146.00, 146.50, 147.00
Technical Levels: Supports and Resistances
USDJPY currently trading at 145.88 at the time of writing. Pair opened at 146.22 and is trading with a change of -0.23 % .
| Overview | Overview.1 | |
|---|---|---|
| 0 | Today last price | 145.88 |
| 1 | Today Daily Change | -0.34 |
| 2 | Today Daily Change % | -0.23 |
| 3 | Today daily open | 146.22 |
The pair remains strongly bullish on the daily timeframe. It trades above its 20 SMA @ 143.47, 50 SMA 142.45, 100 SMA @ 139.32 and 200 SMA @ 136.56.
| Trends | Trends.1 | |
|---|---|---|
| 0 | Daily SMA20 | 143.47 |
| 1 | Daily SMA50 | 142.45 |
| 2 | Daily SMA100 | 139.32 |
| 3 | Daily SMA200 | 136.56 |
The previous day high was 146.4 while the previous day low was 145.15. The daily 38.2% Fib levels comes at 145.92, expected to provide resistance. Similarly, the daily 61.8% fib level is at 145.63, expected to provide support.
Note the levels of interest below:
- Pivot support is noted at 145.44, 144.67, 144.19
- Pivot resistance is noted at 146.7, 147.18, 147.96
| Levels | Levels.1 |
|---|---|
| Previous Daily High | 146.40 |
| Previous Daily Low | 145.15 |
| Previous Weekly High | 146.56 |
| Previous Weekly Low | 144.65 |
| Previous Monthly High | 144.91 |
| Previous Monthly Low | 137.24 |
| Daily Fibonacci 38.2% | 145.92 |
| Daily Fibonacci 61.8% | 145.63 |
| Daily Pivot Point S1 | 145.44 |
| Daily Pivot Point S2 | 144.67 |
| Daily Pivot Point S3 | 144.19 |
| Daily Pivot Point R1 | 146.70 |
| Daily Pivot Point R2 | 147.18 |
| Daily Pivot Point R3 | 147.96 |
[/s2If]
Download Nehcap EAWe have two EAs that are operational on our LIVE accounts.
- EA-FIX: Check out the details here. Download EA-FIX . EA-FIX is a non-grid HFT scalper.
- EA-GROWTH: High quality low dd EA using trend grids. Download EA_GROWTHJoin Our Telegram Group
")


