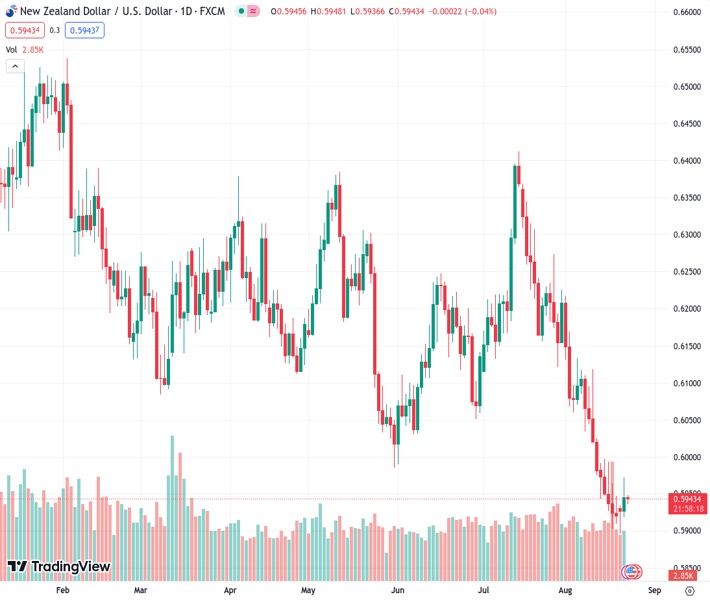
The New Zealand dollar to US dollar exchange rate is currently at 0.59435. In the US, there has been a 2.2% decrease in existing home sales, compared to a 3.3% decline in the previous month of June. Additionally, the Richmond Federal Reserve’s Manufacturing Index has dropped from -9 to -7.
…
This is a premium post.
[s2If !current_user_can(access_s2member_level4)]Please register for FREE REGISTER to read full post below containing analysis. In case of any error or you think you are not able to read the full post below, please email us at support#nehcap.com [lwa][/s2If] [s2If current_user_can(access_s2member_level1)]
- US Existing Home Sales declined 2.2% vs a 3.3% drop in June. Richmond Fed’s Manufacturing Index fell to -7 from -9.
The pair currently trades last at 0.59435.
The previous day high was 0.5936 while the previous day low was 0.5895. The daily 38.2% Fib levels comes at 0.591, expected to provide support. Similarly, the daily 61.8% fib level is at 0.592, expected to provide support.
The NZD/USD pair remains flat around 0.5945 during the early Asian session on Wednesday. Markets turn cautious ahead of the Jackson Hole symposium. Meanwhile, the US Dollar Index (DXY), a measure of the value of USD against six other major currencies, rebounds and holds above 103.60.
On Tuesday, Existing Home Sales in the US declined 2.2% in July versus a 3.3% drop in June. Meanwhile, the Richmond Fed Manufacturing Index for August fell to -7 from -9, in line with market expectations.
In addition to the upbeat US data, hawkish comments from Federal Reserve Bank of Richmond President Thomas Barkin support the Dollar’s recovery. Barkin said on Tuesday that monetary policy would need to be tightened if inflation remained elevated and there was no evidence that demand would fall.
On the other hand, the latest data from Statistics New Zealand revealed on Wednesday that the nation’s Retail Sales QoQ for the second quarter improves to -1.0 versus market expectations of -2.6% and -1.4% prior. Apart from the data, the Reserve Bank of New Zealand (RBNZ) Chief Economist stated that the central bank is aware of the decline in the New Zealand Dollar. In addition, policymakers would lower the OCR sooner than we have signaled if China experienced a more significant deceleration than the RBNZ anticipates.
Market players will take cues from China’s developments and market sentiment. the US Commerce Department’s statement reported on late Tuesday that US Commerce Secretary Gina Raimondo met the Chinese ambassador Xie Feng, and had a productive discussion before her departure to China, according to Reuters. However, the renewed tension between the US-China could exert pressure on the Kiwi and acts as a headwind for the NZD/USD pair.
Looking ahead, US S&P Global PMI data will be released later on Wednesday. The key event will be Jackson Hole annual symposium on Thursday and Fed Chair Powell’s speech on Friday. The event will be critical for determining a clear movement for the NZD/USD pair.
Technical Levels: Supports and Resistances
NZDUSD currently trading at 0.5947 at the time of writing. Pair opened at 0.5929 and is trading with a change of 0.3 % .
| Overview | Overview.1 | |
|---|---|---|
| 0 | Today last price | 0.5947 |
| 1 | Today Daily Change | 0.0018 |
| 2 | Today Daily Change % | 0.3000 |
| 3 | Today daily open | 0.5929 |
The pair remains strongly bearish on the daily time frame. It trades below the 20 SMA @ 0.6062, 50 SMA 0.6146, 100 SMA @ 0.6166 and 200 SMA @ 0.6231.
| Trends | Trends.1 | |
|---|---|---|
| 0 | Daily SMA20 | 0.6062 |
| 1 | Daily SMA50 | 0.6146 |
| 2 | Daily SMA100 | 0.6166 |
| 3 | Daily SMA200 | 0.6231 |
The previous day high was 0.5936 while the previous day low was 0.5895. The daily 38.2% Fib levels comes at 0.591, expected to provide support. Similarly, the daily 61.8% fib level is at 0.592, expected to provide support.
Note the levels of interest below:
- Pivot support is noted at 0.5904, 0.5879, 0.5864
- Pivot resistance is noted at 0.5945, 0.596, 0.5985
| Levels | Levels.1 |
|---|---|
| Previous Daily High | 0.5936 |
| Previous Daily Low | 0.5895 |
| Previous Weekly High | 0.5997 |
| Previous Weekly Low | 0.5903 |
| Previous Monthly High | 0.6413 |
| Previous Monthly Low | 0.6120 |
| Daily Fibonacci 38.2% | 0.5910 |
| Daily Fibonacci 61.8% | 0.5920 |
| Daily Pivot Point S1 | 0.5904 |
| Daily Pivot Point S2 | 0.5879 |
| Daily Pivot Point S3 | 0.5864 |
| Daily Pivot Point R1 | 0.5945 |
| Daily Pivot Point R2 | 0.5960 |
| Daily Pivot Point R3 | 0.5985 |
[/s2If]
Download Nehcap EAWe have two EAs that are operational on our LIVE accounts.
- EA-FIX: Check out the details here. Download EA-FIX . EA-FIX is a non-grid HFT scalper.
- EA-GROWTH: High quality low dd EA using trend grids. Download EA_GROWTHJoin Our Telegram Group
")


