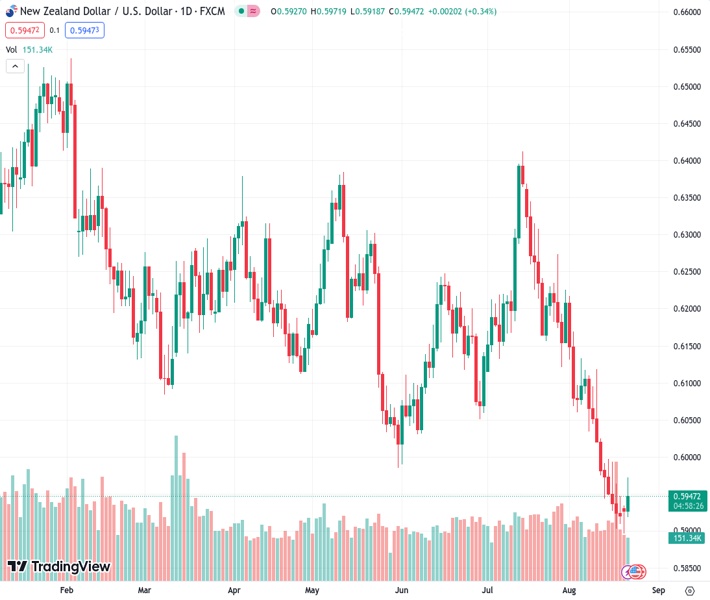
The New Zealand dollar to US dollar exchange rate is at 0.59459. Existing Home Sales in the US experienced a decline of 2.2% in July, attributed to limited availability of homes for sale and an increase in mortgage rates.
…
This is a premium post.
[s2If !current_user_can(access_s2member_level4)]Please register for FREE REGISTER to read full post below containing analysis. In case of any error or you think you are not able to read the full post below, please email us at support#nehcap.com [lwa][/s2If] [s2If current_user_can(access_s2member_level1)]
- US Existing Home Sales drop by -2.2% in July, with “inventory availability” and higher “mortgage rates” cited as reasons.
The pair currently trades last at 0.59459.
The previous day high was 0.5936 while the previous day low was 0.5895. The daily 38.2% Fib levels comes at 0.591, expected to provide support. Similarly, the daily 61.8% fib level is at 0.592, expected to provide support.
NZD/USD recovers some ground though exchanges hands off the highs of the day of 0.5972, trading at 0.5941, amidst a mixed market mood spurred by fears about recent developments in China and uncertainty about the outcome of US Federal Reserve Chair Jerome Powell’s speech at Jackson Hole.
US equities dwindle as market sentiment remains fragile. The National Association of Realtors (NAR) revealed that Existing Home Sales plunged -2.2% in July but improved compared to June’s -3.3% figures. According to the report, “inventory availability” and higher “mortgage rates” are the drivers behind the latest report drop, revealed NAR Chief Economist Lawrence Yun.
In other data revealed by the Richmond Fed, the Manufacturing Index plummeted -7 as expected in August, though its Services Index exceeded estimates of a -4 contraction, came at 4.
US bond yields are mixed as the short-end of the curve continues to bull-steepen, while the 10s, 20s, and 30s drop between 0.18 and 0.47 percent. However, the Greenback (USD) continues to rise, with the US Dollar Index (DXY), a measure of the buck’s value vs. six currencies, advancing 0.26%, at 103.588.
Meanwhile, Richmond Fed President Thomas Barkin emphasized that reaching the 2% target is crucial to Fed’s credibility. Later on the day, further, Fed policymakers will cross the wires, with Bowman and Golsbee up next.
On the New Zealand (NZ) front, the lack of economic data keeps traders seeking direction on China’s latest developments and market sentiment. Nevertheless, Retail Sales for the Second Quarter will be revealed on Wednesday, estimated to exceed the prior’s quarter yearly figures, while quarter-on-quarter (QoQ) is foreseen to disappoint investors. Hence, further NZD/USD could be expected.
On the US front, the economic docket would feature Fed speakers, S&P Global PMIs, Durable Good Orders, and New Home Sales.
The NZDUSD remains downward biased even though it bounced off year-to-date (YTD) lows of 0.5896. If NZD/USD buyers want to shift the trend to neutral, they must reclaim May 31 daily low turned resistance at 0.5985, followed by the 0.6031 June 8 daily low. Nevertheless, the NZD/USD’s path of least resistance is downwards, and it could test the November 10 daily low of 0.5840, followed by the November 3 swing low of 0.5741.
Technical Levels: Supports and Resistances
NZDUSD currently trading at 0.5945 at the time of writing. Pair opened at 0.5929 and is trading with a change of 0.27 % .
| Overview | Overview.1 | |
|---|---|---|
| 0 | Today last price | 0.5945 |
| 1 | Today Daily Change | 0.0016 |
| 2 | Today Daily Change % | 0.2700 |
| 3 | Today daily open | 0.5929 |
The pair remains strongly bearish on the daily time frame. It trades below the 20 SMA @ 0.6062, 50 SMA 0.6146, 100 SMA @ 0.6166 and 200 SMA @ 0.6231.
| Trends | Trends.1 | |
|---|---|---|
| 0 | Daily SMA20 | 0.6062 |
| 1 | Daily SMA50 | 0.6146 |
| 2 | Daily SMA100 | 0.6166 |
| 3 | Daily SMA200 | 0.6231 |
The previous day high was 0.5936 while the previous day low was 0.5895. The daily 38.2% Fib levels comes at 0.591, expected to provide support. Similarly, the daily 61.8% fib level is at 0.592, expected to provide support.
Note the levels of interest below:
- Pivot support is noted at 0.5904, 0.5879, 0.5864
- Pivot resistance is noted at 0.5945, 0.596, 0.5985
| Levels | Levels.1 |
|---|---|
| Previous Daily High | 0.5936 |
| Previous Daily Low | 0.5895 |
| Previous Weekly High | 0.5997 |
| Previous Weekly Low | 0.5903 |
| Previous Monthly High | 0.6413 |
| Previous Monthly Low | 0.6120 |
| Daily Fibonacci 38.2% | 0.5910 |
| Daily Fibonacci 61.8% | 0.5920 |
| Daily Pivot Point S1 | 0.5904 |
| Daily Pivot Point S2 | 0.5879 |
| Daily Pivot Point S3 | 0.5864 |
| Daily Pivot Point R1 | 0.5945 |
| Daily Pivot Point R2 | 0.5960 |
| Daily Pivot Point R3 | 0.5985 |
[/s2If]
Download Nehcap EAWe have two EAs that are operational on our LIVE accounts.
- EA-FIX: Check out the details here. Download EA-FIX . EA-FIX is a non-grid HFT scalper.
- EA-GROWTH: High quality low dd EA using trend grids. Download EA_GROWTHJoin Our Telegram Group
")


