The July data for US Existing Home Sales shows a decrease of 2.2% at a rate of 16.9333 USDMXN. This decline can be attributed to the limited availability of inventory and the increasing mortgage rates.
…
This is a premium post.
[s2If !current_user_can(access_s2member_level4)]Please register for FREE REGISTER to read full post below containing analysis. In case of any error or you think you are not able to read the full post below, please email us at support#nehcap.com [lwa][/s2If] [s2If current_user_can(access_s2member_level1)]
- US Existing Home Sales contract by -2.2% in July, with inventory constraints and rising mortgage rates as key drivers.
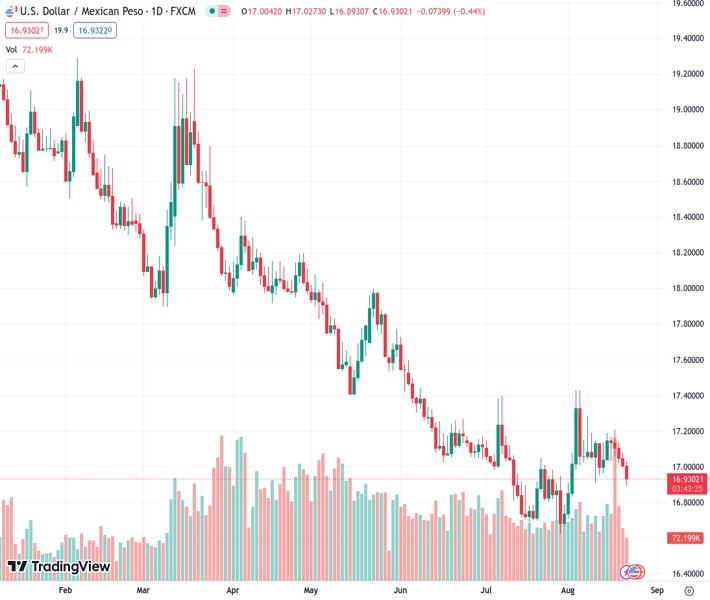
The pair currently trades last at 16.9333.
The previous day high was 17.08 while the previous day low was 16.9983. The daily 38.2% Fib levels comes at 17.0295, expected to provide resistance. Similarly, the daily 61.8% fib level is at 17.0488, expected to provide resistance.
The Mexican Peso (MXN) registered solid gains on Tuesday, as the USD/MXN pair plummeted below the 17.0000 figure amidst the lack of a catalyst, even though the mood has deteriorated. US Treasury bond yields are almost flat, but the greenback gains ground against most G7 currencies. The USD/MXN is trading at 16.9288, down 0.44%.
Wall Street turned negative as the North American session progressed. Existing Home Sales in the US slumped less than expected, still contracted at a -2.2% pace in July, driven by inventory availability and higher mortgage rates. At the same time, Richmond Fed Manufacturing Index dropped to -7 as estimated, while its Services index posted a positive figure, coming at 4, crushing estimates for a -4 plunge.
The USD/MXN is also falling as US bond yields at the long end of the curve fall. The exception is US 3-month and 2-year Treasuries, yielding 5.30% and 5.02%, respectively. According to recent words from Richmond Fed President Thomas Barkin noted, the move in yields is not a sign of “inappropriate” market tightening; instead, he said is a response to strong economic data.
Barkin added that if inflation stays high and the economy strengthens further, “that would make the case” for additional tightening.
In the meantime, the US Dollar Index (DXY), a gauge of the buck’s value against a basket of six currencies, has risen 0.25%, up at 103.579, but so far failed to gain traction against emerging market currencies.
Aside from this, the Mexican economic docket would feature August 1st half inflation on August 24, which is estimated to decrease to 4.67% YoY and 0.28% on monthly figures. Meanwhile, Mexico’s economy minister Raquel Buenrostro told Reuters, “Mexico rules out modifying a decree on genetically modified (GM) corn ahead of a dispute settlement panel requested by the United States through the USMCA trade pact.”
On the US front, the economic docket would feature Fed speakers, S&P Global PMIs, Durable Good Orders, and New Home Sales.
Today, the USD/MXN resumed its downtrend, after standing above the 17.0000 figure for the last 14 days, after clashing with the confluence of the 20 and 50-day Moving Averages (DMAs) at the 17.0000 figure, spurring a fall toward a daily low of 16.8930. Should be said a decisive break below that level, and the pair would challenge the year-to-date (YTD) low of 16.6238. Nevertheless, if USD/MXN reclaims the 17.00 figure, that could pave the way for a test of the 100-DMA at 17.4011.
Technical Levels: Supports and Resistances
USDMXN currently trading at 16.9317 at the time of writing. Pair opened at 17.015 and is trading with a change of -0.49 % .
| Overview | Overview.1 | |
|---|---|---|
| 0 | Today last price | 16.9317 |
| 1 | Today Daily Change | -0.0833 |
| 2 | Today Daily Change % | -0.4900 |
| 3 | Today daily open | 17.0150 |
The pair remains strongly bearish on the daily time frame. It trades below the 20 SMA @ 17.0149, 50 SMA 17.0231, 100 SMA @ 17.42 and 200 SMA @ 18.1789.
| Trends | Trends.1 | |
|---|---|---|
| 0 | Daily SMA20 | 17.0149 |
| 1 | Daily SMA50 | 17.0231 |
| 2 | Daily SMA100 | 17.4200 |
| 3 | Daily SMA200 | 18.1789 |
The previous day high was 17.08 while the previous day low was 16.9983. The daily 38.2% Fib levels comes at 17.0295, expected to provide resistance. Similarly, the daily 61.8% fib level is at 17.0488, expected to provide resistance.
Note the levels of interest below:
- Pivot support is noted at 16.9822, 16.9494, 16.9004
- Pivot resistance is noted at 17.0639, 17.1128, 17.1456
| Levels | Levels.1 |
|---|---|
| Previous Daily High | 17.0800 |
| Previous Daily Low | 16.9983 |
| Previous Weekly High | 17.2094 |
| Previous Weekly Low | 16.9663 |
| Previous Monthly High | 17.3957 |
| Previous Monthly Low | 16.6258 |
| Daily Fibonacci 38.2% | 17.0295 |
| Daily Fibonacci 61.8% | 17.0488 |
| Daily Pivot Point S1 | 16.9822 |
| Daily Pivot Point S2 | 16.9494 |
| Daily Pivot Point S3 | 16.9004 |
| Daily Pivot Point R1 | 17.0639 |
| Daily Pivot Point R2 | 17.1128 |
| Daily Pivot Point R3 | 17.1456 |
[/s2If]
Download Nehcap EAWe have two EAs that are operational on our LIVE accounts.
- EA-FIX: Check out the details here. Download EA-FIX . EA-FIX is a non-grid HFT scalper.
- EA-GROWTH: High quality low dd EA using trend grids. Download EA_GROWTHJoin Our Telegram Group
")


