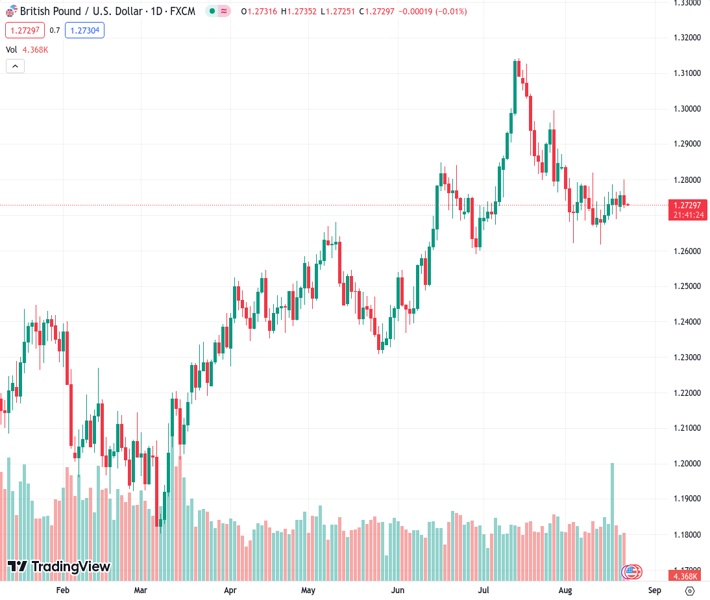
The GBPUSD currency pair is currently stagnant at a level of 1.27298, following a reversal from a low point experienced over the past two weeks. According to the perspective of @nehcap, it is anticipated that the pair will gradually decline.
…
This is a premium post.
[s2If !current_user_can(access_s2member_level4)]Please register for FREE REGISTER to read full post below containing analysis. In case of any error or you think you are not able to read the full post below, please email us at support#nehcap.com [lwa][/s2If] [s2If current_user_can(access_s2member_level1)]
- GBP/USD remains on the sideline after reversing from two-week low.
The pair currently trades last at 1.27298.
The previous day high was 1.2767 while the previous day low was 1.271. The daily 38.2% Fib levels comes at 1.2745, expected to provide resistance. Similarly, the daily 61.8% fib level is at 1.2732, expected to provide resistance.
GBP/USD edges lower past 1.2750 after reversing from the highest level in a fortnight the previous day, mostly quiet around 1.2750 amid the early hours of Wednesday’s Asian session. In doing so, the Cable pair portrays the market’s cautious mood ahead of the preliminary readings of the August month Purchasing Managers Indexes (PMIs) for the UK and the US.
That said, a three-week-old symmetrical triangle formation restricts immediate Pound Sterling moves between 1.2710 and 1.2800. It’s worth noting that the steady RSI (14) also portrays the market’s indecision.
Apart from the symmetrical triangle, an ascending support line from late June and the 200-SMA hurdle, respectively near 1.2680 and 1.2835, also act as additional trading filters for the GBP/USD pair.
It’s worth noting, however, that an upside break of the 200-SMA won’t hesitate to challenge the late July swing high of around 1.3000 whereas the Pound Sterling’s fall below 1.2680 will aim for the June 29 swing low of surrounding 1.2590.
Above all, the GBP/USD maintains the gradual downtrend from the mid-July peak despite the latest inaction. That said, a likely softer UK PMIs can keep the Cable bears even if the US activity data matches the unimpressive forecasts.
Also read: GBP/USD post losses amidst risk aversion, China’s economic woes
Trend: Gradual downside expected
Technical Levels: Supports and Resistances
GBPUSD currently trading at 1.273 at the time of writing. Pair opened at 1.2756 and is trading with a change of -0.20% % .
| Overview | Overview.1 | |
|---|---|---|
| 0 | Today last price | 1.273 |
| 1 | Today Daily Change | -0.0026 |
| 2 | Today Daily Change % | -0.20% |
| 3 | Today daily open | 1.2756 |
The pair is trading below its 20 Daily moving average @ 1.2763, below its 50 Daily moving average @ 1.2793 , above its 100 Daily moving average @ 1.2632 and above its 200 Daily moving average @ 1.2384
| Trends | Trends.1 | |
|---|---|---|
| 0 | Daily SMA20 | 1.2763 |
| 1 | Daily SMA50 | 1.2793 |
| 2 | Daily SMA100 | 1.2632 |
| 3 | Daily SMA200 | 1.2384 |
The previous day high was 1.2767 while the previous day low was 1.271. The daily 38.2% Fib levels comes at 1.2745, expected to provide resistance. Similarly, the daily 61.8% fib level is at 1.2732, expected to provide resistance.
Note the levels of interest below:
- Pivot support is noted at 1.2722, 1.2688, 1.2666
- Pivot resistance is noted at 1.2778, 1.2801, 1.2835
| Levels | Levels.1 |
|---|---|
| Previous Daily High | 1.2767 |
| Previous Daily Low | 1.2710 |
| Previous Weekly High | 1.2788 |
| Previous Weekly Low | 1.2617 |
| Previous Monthly High | 1.3142 |
| Previous Monthly Low | 1.2659 |
| Daily Fibonacci 38.2% | 1.2745 |
| Daily Fibonacci 61.8% | 1.2732 |
| Daily Pivot Point S1 | 1.2722 |
| Daily Pivot Point S2 | 1.2688 |
| Daily Pivot Point S3 | 1.2666 |
| Daily Pivot Point R1 | 1.2778 |
| Daily Pivot Point R2 | 1.2801 |
| Daily Pivot Point R3 | 1.2835 |
[/s2If]
Download Nehcap EAWe have two EAs that are operational on our LIVE accounts.
- EA-FIX: Check out the details here. Download EA-FIX . EA-FIX is a non-grid HFT scalper.
- EA-GROWTH: High quality low dd EA using trend grids. Download EA_GROWTHJoin Our Telegram Group
")


