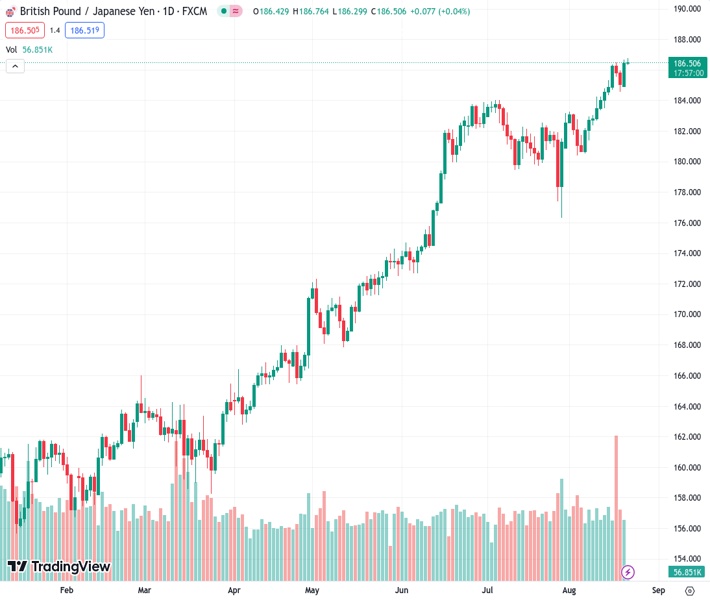
The GBPJPY is currently trading near its peak at 186.77, which is an all-time high.
…
This is a premium post.
[s2If !current_user_can(access_s2member_level4)]Please register for FREE REGISTER to read full post below containing analysis. In case of any error or you think you are not able to read the full post below, please email us at support#nehcap.com [lwa][/s2If] [s2If current_user_can(access_s2member_level1)]
- GBP/JPY trades around an all-time high at 186.77.
The pair currently trades last at 186.509.
The previous day high was 186.66 while the previous day low was 184.89. The daily 38.2% Fib levels comes at 185.99, expected to provide support. Similarly, the daily 61.8% fib level is at 185.57, expected to provide support.
GBP/JPY marked an all-time high at 186.77 in the early trading hours of the Asian session on Tuesday. Spot price is trading around 186.50 at the time of writing. The pair retreats from the all-time high as it appeared to be a barrier. A break above that level could help the GBP/JPY pair to explore further highs around the 187.00 psychological level.
The Moving Average Convergence Divergence (MACD) line indicates the buying bias in the pair as it stays in the positive territory of the centerline and stays above the signal line. The 14-day Relative Strength Index (RSI) remains above 50, which confirms a bullish sentiment of GBP/JPY buyers.
The GBP/JPY pair could face immediate support around the nine-day Exponential Moving Average (EMA) at 185.24 aligned to 23.6% Fibonacci retracement at 184.30.
A break below the latter could help the sellers to navigate the area around 184.00 psychological level, followed by the 21-day EMA at 183.86.
Technical Levels: Supports and Resistances
GBPJPY currently trading at 186.49 at the time of writing. Pair opened at 186.52 and is trading with a change of -0.02 % .
| Overview | Overview.1 | |
|---|---|---|
| 0 | Today last price | 186.49 |
| 1 | Today Daily Change | -0.03 |
| 2 | Today Daily Change % | -0.02 |
| 3 | Today daily open | 186.52 |
The pair remains strongly bullish on the daily timeframe. It trades above its 20 SMA @ 183.09, 50 SMA 182.21, 100 SMA @ 176.02 and 200 SMA @ 169.19.
| Trends | Trends.1 | |
|---|---|---|
| 0 | Daily SMA20 | 183.09 |
| 1 | Daily SMA50 | 182.21 |
| 2 | Daily SMA100 | 176.02 |
| 3 | Daily SMA200 | 169.19 |
The previous day high was 186.66 while the previous day low was 184.89. The daily 38.2% Fib levels comes at 185.99, expected to provide support. Similarly, the daily 61.8% fib level is at 185.57, expected to provide support.
Note the levels of interest below:
- Pivot support is noted at 185.39, 184.25, 183.61
- Pivot resistance is noted at 187.16, 187.8, 188.93
| Levels | Levels.1 |
|---|---|
| Previous Daily High | 186.66 |
| Previous Daily Low | 184.89 |
| Previous Weekly High | 186.47 |
| Previous Weekly Low | 183.46 |
| Previous Monthly High | 184.02 |
| Previous Monthly Low | 176.32 |
| Daily Fibonacci 38.2% | 185.99 |
| Daily Fibonacci 61.8% | 185.57 |
| Daily Pivot Point S1 | 185.39 |
| Daily Pivot Point S2 | 184.25 |
| Daily Pivot Point S3 | 183.61 |
| Daily Pivot Point R1 | 187.16 |
| Daily Pivot Point R2 | 187.80 |
| Daily Pivot Point R3 | 188.93 |
[/s2If]
Download Nehcap EAWe have two EAs that are operational on our LIVE accounts.
- EA-FIX: Check out the details here. Download EA-FIX . EA-FIX is a non-grid HFT scalper.
- EA-GROWTH: High quality low dd EA using trend grids. Download EA_GROWTHJoin Our Telegram Group
")


