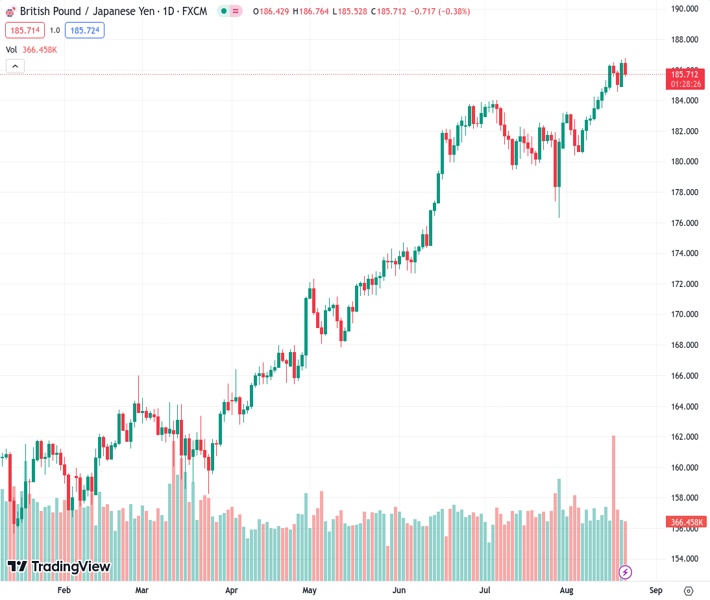
The GBPJPY currency pair, currently at a rate of 185.765, experienced a decrease of 0.34% and is now trading at 185.80. This decline was primarily driven by a reduction in the yield of the US 10-year Treasury bond.
…
This is a premium post.
[s2If !current_user_can(access_s2member_level4)]Please register for FREE REGISTER to read full post below containing analysis. In case of any error or you think you are not able to read the full post below, please email us at support#nehcap.com [lwa][/s2If] [s2If current_user_can(access_s2member_level1)]
- GBP/JPY dropped 0.34%, trading at 185.80, influenced by a dip in US 10-year Treasury bond yield.
The pair currently trades last at 185.765.
The previous day high was 186.66 while the previous day low was 184.89. The daily 38.2% Fib levels comes at 185.99, expected to provide resistance. Similarly, the daily 61.8% fib level is at 185.57, expected to provide support.
GBP/JPY hits a new year-to-date (YTD) high but retraces as the Japanese Yen (JPY) strengthens during Tuesday’s session and remains the second strongest currency in the day. A drop in the US 10-year Treasury bond yield undermined the USD/JPY pair; hence the GBP/JPY dropped. At the time of writing, the GBP/JPY is trading at 185.80, with losses of 0.34%.
From a daily chart perspective, the GBP/JPY remains upward biased, though it seems that some buyers book profits, as Japanese authorities remain vocal about a possible intervention to boost the Yen. Despite dipping to a daily low of 185.52, the pair would likely test the 186.00 figure, followed by a challenge of the 187.00 psychological level.
In the short term, the GBP/JPY hourly chart portrays the pair peaked around the new YTD high and retraced below the Asian session low of 186.29, plunging 70 pips toward its daily low. It should be said the GBP/JPY dive was cushioned by the Senkou Span B support at around 185.50; since then, the cross-currency pair edged towards the confluence of the top of the Ichimoku Cloud (Kumo) and the Tenkan-Sen line at 185.85. Once those levels are cleared, the next stop would be the daily pivot point at 185.99. A daily close below 186.00 could pave the way for further losses.
Technical Levels: Supports and Resistances
GBPJPY currently trading at 185.84 at the time of writing. Pair opened at 186.52 and is trading with a change of -0.36 % .
| Overview | Overview.1 | |
|---|---|---|
| 0 | Today last price | 185.84 |
| 1 | Today Daily Change | -0.68 |
| 2 | Today Daily Change % | -0.36 |
| 3 | Today daily open | 186.52 |
The pair remains strongly bullish on the daily timeframe. It trades above its 20 SMA @ 183.09, 50 SMA 182.21, 100 SMA @ 176.02 and 200 SMA @ 169.19.
| Trends | Trends.1 | |
|---|---|---|
| 0 | Daily SMA20 | 183.09 |
| 1 | Daily SMA50 | 182.21 |
| 2 | Daily SMA100 | 176.02 |
| 3 | Daily SMA200 | 169.19 |
The previous day high was 186.66 while the previous day low was 184.89. The daily 38.2% Fib levels comes at 185.99, expected to provide resistance. Similarly, the daily 61.8% fib level is at 185.57, expected to provide support.
Note the levels of interest below:
- Pivot support is noted at 185.39, 184.25, 183.61
- Pivot resistance is noted at 187.16, 187.8, 188.93
| Levels | Levels.1 |
|---|---|
| Previous Daily High | 186.66 |
| Previous Daily Low | 184.89 |
| Previous Weekly High | 186.47 |
| Previous Weekly Low | 183.46 |
| Previous Monthly High | 184.02 |
| Previous Monthly Low | 176.32 |
| Daily Fibonacci 38.2% | 185.99 |
| Daily Fibonacci 61.8% | 185.57 |
| Daily Pivot Point S1 | 185.39 |
| Daily Pivot Point S2 | 184.25 |
| Daily Pivot Point S3 | 183.61 |
| Daily Pivot Point R1 | 187.16 |
| Daily Pivot Point R2 | 187.80 |
| Daily Pivot Point R3 | 188.93 |
[/s2If]
Download Nehcap EAWe have two EAs that are operational on our LIVE accounts.
- EA-FIX: Check out the details here. Download EA-FIX . EA-FIX is a non-grid HFT scalper.
- EA-GROWTH: High quality low dd EA using trend grids. Download EA_GROWTHJoin Our Telegram Group
")


