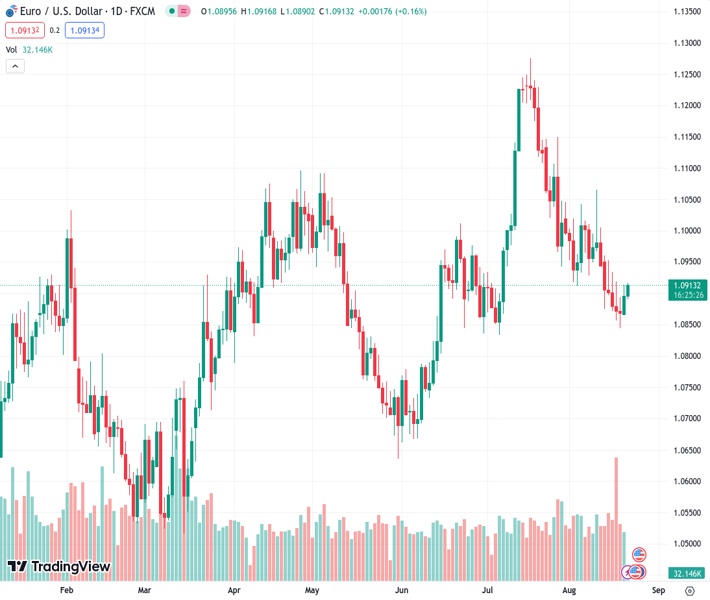
The EURUSD currency pair has increased in value for the second consecutive day at a rate of 1.09126, as it benefits from a weaker US dollar.
…
This is a premium post.
[s2If !current_user_can(access_s2member_level4)]Please register for FREE REGISTER to read full post below containing analysis. In case of any error or you think you are not able to read the full post below, please email us at support#nehcap.com [lwa][/s2If] [s2If current_user_can(access_s2member_level1)]
- EUR/USD edges higher for the second straight day and draws support from a softer USD.
The pair currently trades last at 1.09126.
The previous day high was 1.0914 while the previous day low was 1.0867. The daily 38.2% Fib levels comes at 1.0896, expected to provide support. Similarly, the daily 61.8% fib level is at 1.0885, expected to provide support.
The EUR/USD pair gains some positive traction for the second successive day on Tuesday and climbs back above the 1.0900 mark during the Asian session. Spot prices currently trade near a three-day top and look to build on the recent bounce from over a two-month trough, around the 1.0845 region touched last Friday.
The European Central Bank (ECB) Chief Economist Philip Lane said on Friday the Euro Zone economy would keep growing and is unlikely to experience a deep or sustained recession. This leads to the narrowing of the German yield curve inversion and supports prospects for further policy tightening by the ECB, which is seen underpinning the shared currency. Apart from this, a modest US Dollar (USD) weakness turns out to be another factor acting as a tailwind for the EUR/USD pair.
In fact, the USD Index (DXY), which tracks the Greenback against a basket of currencies, remains depressed below its highest level since July 12 as traders are still betting on the idea that the Federal Reserve (Fed) will pause its rate-hiking cycle in September. That said, the incoming US economic data continues to point to an extremely resilient economy and keeps the door open for one more 25 bps lift-off by the end of this year, which should help limit any meaningful USD losses.
The view that the Fed will keep interest rates higher for longer remains supportive of elevated US Treasury bond yields. It is worth recalling that the yield on the benchmark 10-year US government bond had climbed to a fresh 15-year top on Monday. Apart from this, a generally weaker risk tone assists the safe-haven USD to hold just above a technically significant 200-day Simple Moving Average (USD). This might hold back bulls from placing aggressive bets around the EUR/USD pair.
Investors might also prefer to move to the sidelines ahead of Fed Chair Jerome Powell and ECB President Christine Lagarde’s speech at the Jackson Hole Symposium later this week. Investors will further take cues from the flash version of the PMI prints from the Euro Zone and the US, due on Wednesday, which will provide fresh insights into the economic health and whether the respective central banks can afford to increase interest rates further.
In the meantime, traders on Tuesday will take cues from the release of the Euro Zone Current Account figures, which will be followed by Existing Home Sale and Richmond Manufacturing Index later during the early North American session from the US. This, along with the US bond yields and the broader risk sentiment, will influence the USD price dynamics and produce short-term trading opportunities around the EUR/USD pair.
Technical Levels: Supports and Resistances
EURUSD currently trading at 1.0916 at the time of writing. Pair opened at 1.0896 and is trading with a change of 0.18 % .
| Overview | Overview.1 | |
|---|---|---|
| 0 | Today last price | 1.0916 |
| 1 | Today Daily Change | 0.0020 |
| 2 | Today Daily Change % | 0.1800 |
| 3 | Today daily open | 1.0896 |
The pair is trading below its 20 Daily moving average @ 1.096, below its 50 Daily moving average @ 1.098 , below its 100 Daily moving average @ 1.0931 and above its 200 Daily moving average @ 1.0794
| Trends | Trends.1 | |
|---|---|---|
| 0 | Daily SMA20 | 1.0960 |
| 1 | Daily SMA50 | 1.0980 |
| 2 | Daily SMA100 | 1.0931 |
| 3 | Daily SMA200 | 1.0794 |
The previous day high was 1.0914 while the previous day low was 1.0867. The daily 38.2% Fib levels comes at 1.0896, expected to provide support. Similarly, the daily 61.8% fib level is at 1.0885, expected to provide support.
Note the levels of interest below:
- Pivot support is noted at 1.087, 1.0845, 1.0824
- Pivot resistance is noted at 1.0917, 1.0939, 1.0964
| Levels | Levels.1 |
|---|---|
| Previous Daily High | 1.0914 |
| Previous Daily Low | 1.0867 |
| Previous Weekly High | 1.0960 |
| Previous Weekly Low | 1.0845 |
| Previous Monthly High | 1.1276 |
| Previous Monthly Low | 1.0834 |
| Daily Fibonacci 38.2% | 1.0896 |
| Daily Fibonacci 61.8% | 1.0885 |
| Daily Pivot Point S1 | 1.0870 |
| Daily Pivot Point S2 | 1.0845 |
| Daily Pivot Point S3 | 1.0824 |
| Daily Pivot Point R1 | 1.0917 |
| Daily Pivot Point R2 | 1.0939 |
| Daily Pivot Point R3 | 1.0964 |
[/s2If]
Download Nehcap EAWe have two EAs that are operational on our LIVE accounts.
- EA-FIX: Check out the details here. Download EA-FIX . EA-FIX is a non-grid HFT scalper.
- EA-GROWTH: High quality low dd EA using trend grids. Download EA_GROWTHJoin Our Telegram Group
")


