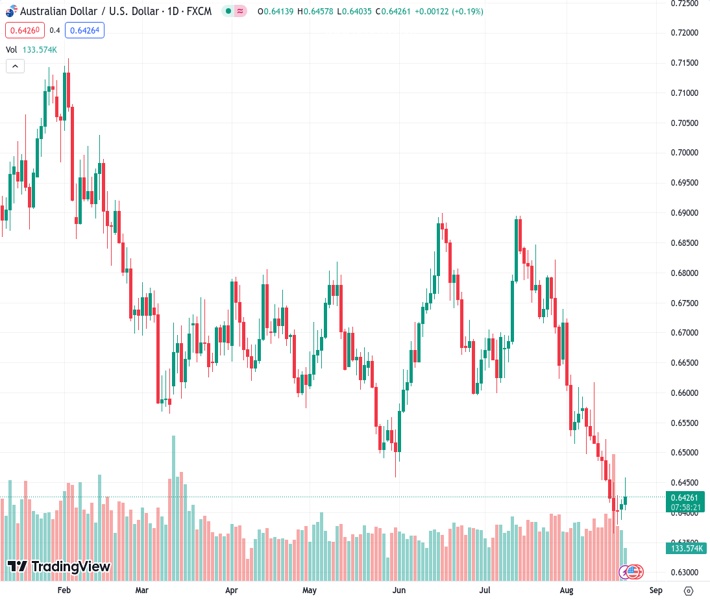
The AUDUSD currency pair has experienced a recovery, rising from a consolidation phase around 0.6400, as the US Dollar weakened.
…
This is a premium post.
[s2If !current_user_can(access_s2member_level4)]Please register for FREE REGISTER to read full post below containing analysis. In case of any error or you think you are not able to read the full post below, please email us at support#nehcap.com [lwa][/s2If] [s2If current_user_can(access_s2member_level1)]
- AUD/USD rebounds after consolidating around 0.6400 as US Dollar loses resilience.
The pair currently trades last at 0.64293.
The previous day high was 0.6421 while the previous day low was 0.6387. The daily 38.2% Fib levels comes at 0.6408, expected to provide support. Similarly, the daily 61.8% fib level is at 0.64, expected to provide support.
The AUD/USD pair rebounds after building a base near the round-level support of 0.6400 in the European session. The Aussie asset manages to defend the downside bias as the US Dollar loses resilience ahead of the Jackson Hole Symposium. Also, investors shrugged off deflation risks associated with the Chinese economy as the People’s Bank of China (PBoC) lowered the one-year Prime Lending Rate (PLR) to 3.45%.
The US Dollar Index (DXY) struggles to find a direction after sensing a severe upside restriction near 103.50. The USD Index turns sideways this week after a five-week winning spell as investors await a trigger for further action.
Meanwhile, Economists at UOB Group expect that the RBA has held rates unchanged for two consecutive months, and following the slew of data we think they will keep policy unchanged at its next two meetings on 5 Sep and 3 Oct, unless we get upside inflation surprises from Jul CPI data on 30 Aug and Aug CPI data on 27 Sep.
AUD/USD delivers a breakout of the Symmetrical Triangle chart pattern formed on an hourly scale. A breakout of the aforementioned chart pattern results in wider ticks and heavy volume. The asset stabilizes above the 50-period Exponential Moving Average (EMA) at 0.6420 but still faces barricades near the 200-EMA around 0.6455.
The Relative Strength Index (RSI) (14) shifts into the bullish range of 60.00-80.00, which indicates that the upside impulse has been activated.
A decisive break above August 16 high around 0.6480 will drive the asset toward August 15 high at 0.6522, followed by August 10 high at 0.6616.
In an alternate scenario, a downside move below August 18 low at 0.6380 will negate the triangle breakout and will expose the asset to a fresh nine-month low around 0.6300. Slippage below the latter will expose the asset to 03 November 2022 low at 0.6272.
Technical Levels: Supports and Resistances
AUDUSD currently trading at 0.645 at the time of writing. Pair opened at 0.6414 and is trading with a change of 0.56 % .
| Overview | Overview.1 | |
|---|---|---|
| 0 | Today last price | 0.6450 |
| 1 | Today Daily Change | 0.0036 |
| 2 | Today Daily Change % | 0.5600 |
| 3 | Today daily open | 0.6414 |
The pair remains strongly bearish on the daily time frame. It trades below the 20 SMA @ 0.6557, 50 SMA 0.6669, 100 SMA @ 0.6665 and 200 SMA @ 0.6733.
| Trends | Trends.1 | |
|---|---|---|
| 0 | Daily SMA20 | 0.6557 |
| 1 | Daily SMA50 | 0.6669 |
| 2 | Daily SMA100 | 0.6665 |
| 3 | Daily SMA200 | 0.6733 |
The previous day high was 0.6421 while the previous day low was 0.6387. The daily 38.2% Fib levels comes at 0.6408, expected to provide support. Similarly, the daily 61.8% fib level is at 0.64, expected to provide support.
Note the levels of interest below:
- Pivot support is noted at 0.6394, 0.6373, 0.636
- Pivot resistance is noted at 0.6428, 0.6442, 0.6462
| Levels | Levels.1 |
|---|---|
| Previous Daily High | 0.6421 |
| Previous Daily Low | 0.6387 |
| Previous Weekly High | 0.6522 |
| Previous Weekly Low | 0.6364 |
| Previous Monthly High | 0.6895 |
| Previous Monthly Low | 0.6599 |
| Daily Fibonacci 38.2% | 0.6408 |
| Daily Fibonacci 61.8% | 0.6400 |
| Daily Pivot Point S1 | 0.6394 |
| Daily Pivot Point S2 | 0.6373 |
| Daily Pivot Point S3 | 0.6360 |
| Daily Pivot Point R1 | 0.6428 |
| Daily Pivot Point R2 | 0.6442 |
| Daily Pivot Point R3 | 0.6462 |
[/s2If]
Download Nehcap EAWe have two EAs that are operational on our LIVE accounts.
- EA-FIX: Check out the details here. Download EA-FIX . EA-FIX is a non-grid HFT scalper.
- EA-GROWTH: High quality low dd EA using trend grids. Download EA_GROWTHJoin Our Telegram Group
")


