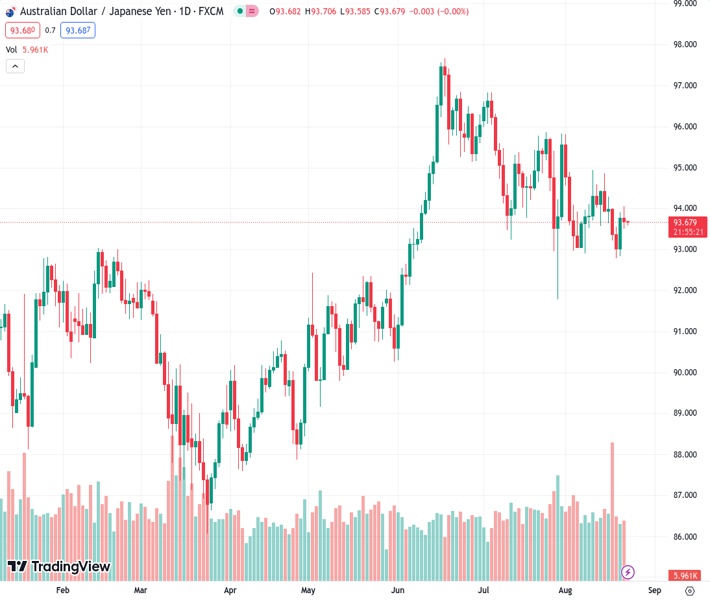
The AUDJPY pair, currently at a rate of 93.67, has decreased by 0.10% from its previous rate of 93.6800. This decline in value can be attributed to the economic issues faced by China and concerns over interest rates in the United States.
…
This is a premium post.
[s2If !current_user_can(access_s2member_level4)]Please register for FREE REGISTER to read full post below containing analysis. In case of any error or you think you are not able to read the full post below, please email us at support#nehcap.com [lwa][/s2If] [s2If current_user_can(access_s2member_level1)]
- AUD/JPY down 0.10%, trading at 93.67, influenced by China’s economic woes and US interest rate concerns.
The pair currently trades last at 93.6800.
The previous day high was 93.91 while the previous day low was 92.83. The daily 38.2% Fib levels comes at 93.5, expected to provide support. Similarly, the daily 61.8% fib level is at 93.24, expected to provide support.
The AUD/JPY trimmed some of Monday’s gains, post losses of 0.10% on Tuesday, though it opens Wednesday’s Asian session with a lower not, exchanging hands at 93.67, down a minuscule 0.01%, at the time of writing. The main drivers for the AUD/JPY fall are risk aversion on China’s woes, US banks feeling the pain of higher interest rates and uncertainty about the US Federal Reserve Chair Powell’s speech at the Jackson Hole Symposium.
The AUD/JPY daily chart portrays the pair continuing its downtrend as the cross-currency pair fell below the Ichimoku Cloud (Kumo). Also, the confluence of the Tenkan and Kijun-Sen lines, at around 93.82, would cap buyers’ intentions of reclaiming the 94.00 figure. Further downside is warranted once the AUD/JPY dives below the last week’s low of 92.78, with the 92.00 psychological level up next, followed by the July 28 low of 91.79.
From an intraday perspective, the AUD/JPY is set to extend its gains, as Monday’s price action lifted the exchange rates from below 92.89, with the pair reaching a week high of 94.06. Buyers’ failure to hold prices above 94.00 exacerbated AUD/JPY’s fall toward the top of the Kumo, with prices bouncing off the day’s low. It should be said that Tenkan and Kijun-Sen portray the pair as bearish, with the latter sitting on top of the former, and intersecting with the daily pivot point at 93.75, seen as a first resistance level. A breach of that level will expose the R1 pivot point at the 94.00 mark.
Conversely, a break below Tuesday’s low of 93.50 could put into play the bottom of the Kumo at 93.30, followed by the S2 pivot level at 93.19, and then the current week’s low of 92.83.
Technical Levels: Supports and Resistances
AUDJPY currently trading at 93.69 at the time of writing. Pair opened at 93.79 and is trading with a change of -0.11 % .
| Overview | Overview.1 | |
|---|---|---|
| 0 | Today last price | 93.69 |
| 1 | Today Daily Change | -0.10 |
| 2 | Today Daily Change % | -0.11 |
| 3 | Today daily open | 93.79 |
The pair is trading below its 20 Daily moving average @ 94.05, below its 50 Daily moving average @ 94.98 , above its 100 Daily moving average @ 92.85 and above its 200 Daily moving average @ 91.91
| Trends | Trends.1 | |
|---|---|---|
| 0 | Daily SMA20 | 94.05 |
| 1 | Daily SMA50 | 94.98 |
| 2 | Daily SMA100 | 92.85 |
| 3 | Daily SMA200 | 91.91 |
The previous day high was 93.91 while the previous day low was 92.83. The daily 38.2% Fib levels comes at 93.5, expected to provide support. Similarly, the daily 61.8% fib level is at 93.24, expected to provide support.
Note the levels of interest below:
- Pivot support is noted at 93.11, 92.43, 92.03
- Pivot resistance is noted at 94.19, 94.59, 95.27
| Levels | Levels.1 |
|---|---|
| Previous Daily High | 93.91 |
| Previous Daily Low | 92.83 |
| Previous Weekly High | 94.87 |
| Previous Weekly Low | 92.79 |
| Previous Monthly High | 96.84 |
| Previous Monthly Low | 91.79 |
| Daily Fibonacci 38.2% | 93.50 |
| Daily Fibonacci 61.8% | 93.24 |
| Daily Pivot Point S1 | 93.11 |
| Daily Pivot Point S2 | 92.43 |
| Daily Pivot Point S3 | 92.03 |
| Daily Pivot Point R1 | 94.19 |
| Daily Pivot Point R2 | 94.59 |
| Daily Pivot Point R3 | 95.27 |
[/s2If]
Download Nehcap EAWe have two EAs that are operational on our LIVE accounts.
- EA-FIX: Check out the details here. Download EA-FIX . EA-FIX is a non-grid HFT scalper.
- EA-GROWTH: High quality low dd EA using trend grids. Download EA_GROWTHJoin Our Telegram Group
")


