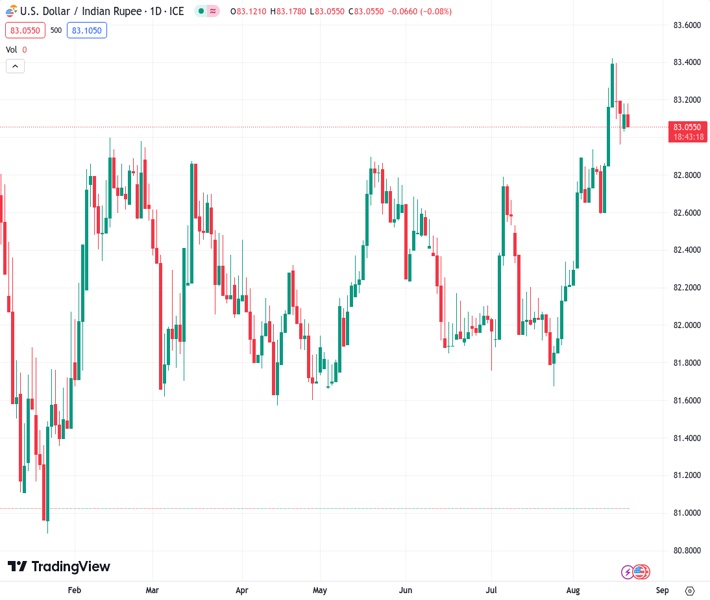
The USDINR pair, currently at 83.1340, is finding it difficult to determine its next move after reaching a new all-time high last week. It has recently reduced its earlier gains during the day.
…
This is a premium post.
[s2If !current_user_can(access_s2member_level4)]Please register for FREE REGISTER to read full post below containing analysis. In case of any error or you think you are not able to read the full post below, please email us at support#nehcap.com [lwa][/s2If] [s2If current_user_can(access_s2member_level1)]
- USD/INR struggles for clear directions after refreshing record top the previous week, pares intraday gains of late.
The pair currently trades last at 83.1340.
The previous day high was 83.2758 while the previous day low was 82.983. The daily 38.2% Fib levels comes at 83.1639, expected to provide resistance. Similarly, the daily 61.8% fib level is at 83.0948, expected to provide support.
USD/INR struggles to extend the previous rebound past 83.00 amid early Monday’s sluggish markets, close to 83.15 at the latest. In doing so, the Indian Rupee (INR) pair jostles with China’s efforts to restore market confidence, mixed concerns about the US Federal Reserve (Fed) and firmer Oil prices. That said, the pair refreshed an all-time high of 83.55 the last Wednesday while posting a four-week uptrend at the latest.
Traders in the Asia-Pacific zone struggle to cheer the People’s Bank of China’s (PBOC) rate cut, as well as signals for more stimulus, amid economic fears surrounding the regional leader, namely Beijing. Also fears about the trade war with the developed nations add filters to the Asian trading and the USD/INR price.
The Financial Times (FT) reported during the weekend that China indirectly pushes for competition with the Group of Seven (G7) nations while marking its presence at the BRICS meeting where officials from Brazil, Russia, India, China and South Africa spoke, signaled.
Elsewhere, WTI crude oil remains firmer around $81.40, up 0.80% intraday amid hopes of more stimulus from China after the dragon nation’s policymakers pledged to defend the economy during the late last week’s meeting.
It should be noted that the US Dollar Index (DXY) remains sidelined, after a downbeat start of the week, as traders remain unclear about Fed Chair Jerome Powell’s monetary policy bias. Recently, Goldman Sachs expects Fed Chair Powell to sound defensive during the annual event of the central bankers but the Bank of America (BofA) expects Fed’s Powell to push back against the rate cut expectations. The reason for these banks’ indecision could be linked to the recently mixed US data and the previous bias about the policy pivot.
Amid these plays, the S&P500 Futures print mild gains around 4,390 to extend the previous day’s rebound from the lowest level since mid-June. On the same line, the US 10-year Treasury bond yields also reverse Friday’s retreat by rising back to 4.28% at the latest.
It should be observed that the upbeat US NY Fed Manufacturing Index, Retail Sales and wage growth allowed the US Dollar to remain firmer for the fifth consecutive week, especially backed by the hawkish Fed Minutes. That said, the latest Fed Minutes showed that most policymakers preferred supporting the battle again the ‘sticky’ inflation, despite being divided on the imminent rate hike. Additionally, the market players started reassessing previous biases about the major central banks and added strength to the risk aversion, primarily fuelled by the China-linked woes.
Furthermore, the Reserve Bank of India’s (RBI) inaction joined the risk aversion wave in Asia to propel the USD/INR previously.
Looking ahead, the August month Purchasing Managers Indexes (PMIs) and China news will entertain the USD/INR traders ahead of the central bankers’ speeches at the annual Jackson Hole Symposium event.
A one-month-old rising support line joins the 10-DMA to restrict the immediate downside of the USD/INR pair near 83.10. That said, the recovery moves can aim for the previous yearly high of around 83.45 before targeting a fresh record high, currently near 83.55.
Technical Levels: Supports and Resistances
USDINR currently trading at 83.1726 at the time of writing. Pair opened at 83.157 and is trading with a change of 0.02% % .
| Overview | Overview.1 | |
|---|---|---|
| 0 | Today last price | 83.1726 |
| 1 | Today Daily Change | 0.0156 |
| 2 | Today Daily Change % | 0.02% |
| 3 | Today daily open | 83.157 |
The pair remains strongly bullish on the daily timeframe. It trades above its 20 SMA @ 82.6985, 50 SMA 82.3572, 100 SMA @ 82.275 and 200 SMA @ 82.2257.
| Trends | Trends.1 | |
|---|---|---|
| 0 | Daily SMA20 | 82.6985 |
| 1 | Daily SMA50 | 82.3572 |
| 2 | Daily SMA100 | 82.2750 |
| 3 | Daily SMA200 | 82.2257 |
The previous day high was 83.2758 while the previous day low was 82.983. The daily 38.2% Fib levels comes at 83.1639, expected to provide resistance. Similarly, the daily 61.8% fib level is at 83.0948, expected to provide support.
Note the levels of interest below:
- Pivot support is noted at 83.0014, 82.8458, 82.7087
- Pivot resistance is noted at 83.2942, 83.4313, 83.5869
| Levels | Levels.1 |
|---|---|
| Previous Daily High | 83.2758 |
| Previous Daily Low | 82.9830 |
| Previous Weekly High | 83.5505 |
| Previous Weekly Low | 82.8946 |
| Previous Monthly High | 82.8334 |
| Previous Monthly Low | 81.6588 |
| Daily Fibonacci 38.2% | 83.1639 |
| Daily Fibonacci 61.8% | 83.0948 |
| Daily Pivot Point S1 | 83.0014 |
| Daily Pivot Point S2 | 82.8458 |
| Daily Pivot Point S3 | 82.7087 |
| Daily Pivot Point R1 | 83.2942 |
| Daily Pivot Point R2 | 83.4313 |
| Daily Pivot Point R3 | 83.5869 |
[/s2If]
Download Nehcap EAWe have two EAs that are operational on our LIVE accounts.
- EA-FIX: Check out the details here. Download EA-FIX . EA-FIX is a non-grid HFT scalper.
- EA-GROWTH: High quality low dd EA using trend grids. Download EA_GROWTHJoin Our Telegram Group
")


