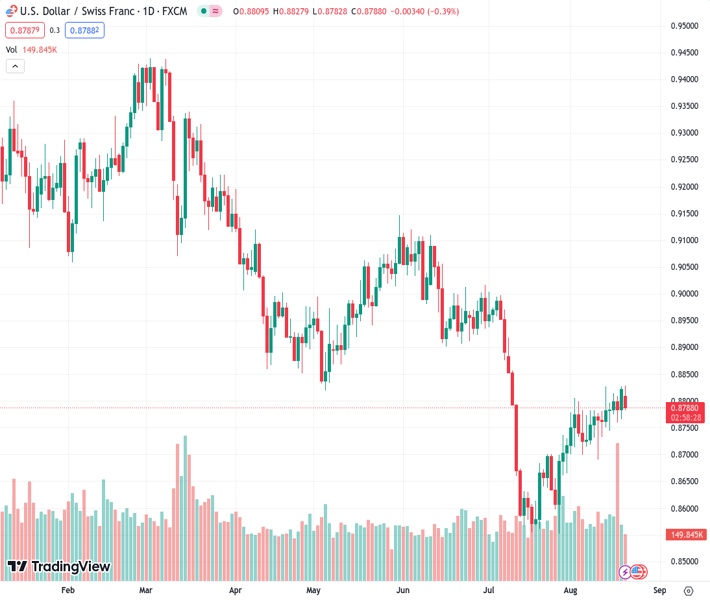
The USDCHF currency pair, currently trading at 0.87878, is struggling to break through the 50-day moving average at 0.8808, resulting in a decrease of 0.38% for the day.
…
This is a premium post.
[s2If !current_user_can(access_s2member_level4)]Please register for FREE REGISTER to read full post below containing analysis. In case of any error or you think you are not able to read the full post below, please email us at support#nehcap.com [lwa][/s2If] [s2If current_user_can(access_s2member_level1)]
- USD/CHF grapples with the 50-DMA at 0.8808, marking a decline of 0.38% for the day.
The pair currently trades last at 0.87878.
The previous day high was 0.8828 while the previous day low was 0.8774. The daily 38.2% Fib levels comes at 0.8807, expected to provide resistance. Similarly, the daily 61.8% fib level is at 0.8794, expected to provide resistance.
USD/CHF clashes with the 50-day Moving Average (DMA) at 0.8808 and retraces, and prints a daily low of 0.8785 amid a choppy trading session as investors brace for the Jackson Hole Symposium, where the US Federal Reserve (Fed) Chair Jerome Powell remarks, are awaited. The USD/CHF is trading at 0.8788, down 0.38%.
The pair remains trending steadily to the upside, but the 50-DMA and its confluence with the 0.8800 figure, exacerbated a dip toward the 0.8780s region. If USD/CHF price action continues to register successive series of higher highs and lows, USD/CHF buyers could reclaim the 50-DMA in the near term and target the June 16 daily low turned resistance at 0.8901. A decisive break would expose the 0.9000 figure.
Conversely, if USD/CHF extends its losses and achieves a daily close below 0.8800, the USD/CHF would dive towards the 2014 swing low of 0.8699, followed by the year-to-date (YTD) low of 0.8552.
Technical Levels: Supports and Resistances
USDCHF currently trading at 0.8789 at the time of writing. Pair opened at 0.8823 and is trading with a change of -0.39 % .
| Overview | Overview.1 | |
|---|---|---|
| 0 | Today last price | 0.8789 |
| 1 | Today Daily Change | -0.0034 |
| 2 | Today Daily Change % | -0.3900 |
| 3 | Today daily open | 0.8823 |
The pair is trading above its 20 Daily moving average @ 0.8741, below its 50 Daily moving average @ 0.8816 , below its 100 Daily moving average @ 0.8903 and below its 200 Daily moving average @ 0.91
| Trends | Trends.1 | |
|---|---|---|
| 0 | Daily SMA20 | 0.8741 |
| 1 | Daily SMA50 | 0.8816 |
| 2 | Daily SMA100 | 0.8903 |
| 3 | Daily SMA200 | 0.9100 |
The previous day high was 0.8828 while the previous day low was 0.8774. The daily 38.2% Fib levels comes at 0.8807, expected to provide resistance. Similarly, the daily 61.8% fib level is at 0.8794, expected to provide resistance.
Note the levels of interest below:
- Pivot support is noted at 0.8789, 0.8754, 0.8735
- Pivot resistance is noted at 0.8842, 0.8862, 0.8896
| Levels | Levels.1 |
|---|---|
| Previous Daily High | 0.8828 |
| Previous Daily Low | 0.8774 |
| Previous Weekly High | 0.8828 |
| Previous Weekly Low | 0.8738 |
| Previous Monthly High | 0.9005 |
| Previous Monthly Low | 0.8552 |
| Daily Fibonacci 38.2% | 0.8807 |
| Daily Fibonacci 61.8% | 0.8794 |
| Daily Pivot Point S1 | 0.8789 |
| Daily Pivot Point S2 | 0.8754 |
| Daily Pivot Point S3 | 0.8735 |
| Daily Pivot Point R1 | 0.8842 |
| Daily Pivot Point R2 | 0.8862 |
| Daily Pivot Point R3 | 0.8896 |
[/s2If]
Download Nehcap EAWe have two EAs that are operational on our LIVE accounts.
- EA-FIX: Check out the details here. Download EA-FIX . EA-FIX is a non-grid HFT scalper.
- EA-GROWTH: High quality low dd EA using trend grids. Download EA_GROWTHJoin Our Telegram Group
")


