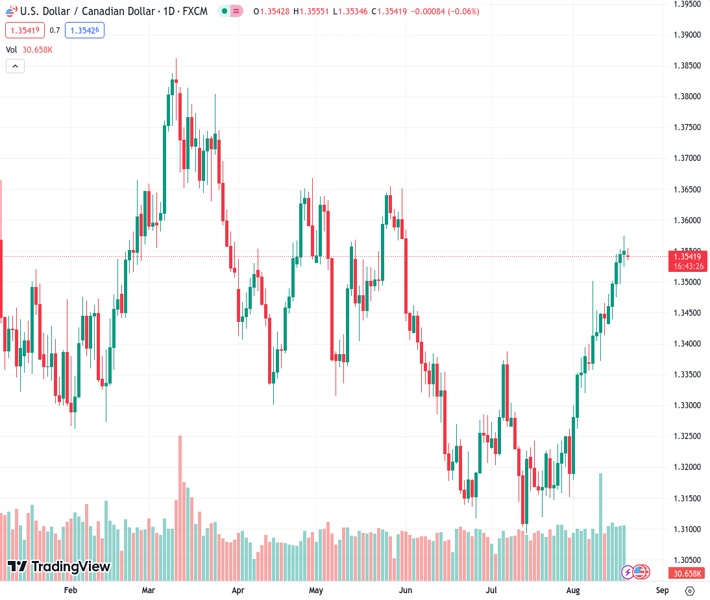
The pair USDCAD is trading at 1.35421 and is currently consolidating the substantial increase it has experienced recently. This marks its highest level since the beginning of June.
…
This is a premium post.
[s2If !current_user_can(access_s2member_level4)]Please register for FREE REGISTER to read full post below containing analysis. In case of any error or you think you are not able to read the full post below, please email us at support#nehcap.com [lwa][/s2If] [s2If current_user_can(access_s2member_level1)]
- USD/CAD consolidates its recent strong gains to its highest level since early June.
The pair currently trades last at 1.35421.
The previous day high was 1.3575 while the previous day low was 1.3524. The daily 38.2% Fib levels comes at 1.3556, expected to provide resistance. Similarly, the daily 61.8% fib level is at 1.3544, expected to provide resistance.
The USD/CAD pair lacks any firm intraday directional bias on Monday and oscillates in a narrow trading band below mid-1.3400s through the Asian session. Spot prices, meanwhile, remain well within the striking distance of the highest level since early June touched on Friday and seem poised to prolong the recent upward trajectory witnessed since the beginning of this month.
Crude Oil prices gain some positive traction for the third successive day and underpin the commodity-linked Loonie. This, along with subdued US Dollar (USD) price action, contributes to acting as a headwind for the USD/CAD pair. That said, elevated US Treasury bond yields, bolstered by rising bets for one more 25 bps lift-off by the Federal Reserve (Fed) in 2023, assist the USD to stand tall near its highest level in more than two months. Apart from this, looming recession fears support prospects for a further appreciating move for the safe-haven buck and validates the positive outlook for the major.
From a technical perspective, the Relative Strength (RSI) on the daily chart hovers above the 70 mark, flashing slightly overbought conditions and holding back bulls from placing fresh bets around the USD/CAD pair. That said, last week’s sustained breakout through the very important 200-day Simple Moving Average (SMA) resistance near the 1.3450 area was seen as a fresh trigger for bullish traders. Moreover, a subsequent move and acceptance beyond the 1.3500 psychological mark validate the constructive outlook. This, in turn, suggests that the path of least resistance for spot prices is to the upside.
It, however, will still be prudent to wait for some near-term consolidation or a modest pullback before positioning for any further gains. Nevertheless, the USD/CAD pair seems poised to surpass Friday’s swing high, around the 1.3575 region, and aim to reclaim the 1.3600 mark for the first time since May. The positive momentum could get extended further towards the next relevant barrier near the 1.3655-1.3660 supply zone.
On the flip side, any meaningful corrective decline is more likely to attract fresh buyers near the 1.3500 mark. This should help limit the downside for the USD/CAD pair near the 1.3450 area, or the 200-day SMA. The latter should act as a strong base, which if broken decisively might prompt aggressive technical selling and expose the 1.3400 round figure before spot prices eventually drop to test the 1.3370 support zone.
Technical Levels: Supports and Resistances
USDCAD currently trading at 1.3544 at the time of writing. Pair opened at 1.3552 and is trading with a change of -0.06 % .
| Overview | Overview.1 | |
|---|---|---|
| 0 | Today last price | 1.3544 |
| 1 | Today Daily Change | -0.0008 |
| 2 | Today Daily Change % | -0.0600 |
| 3 | Today daily open | 1.3552 |
The pair remains strongly bullish on the daily timeframe. It trades above its 20 SMA @ 1.3363, 50 SMA 1.3282, 100 SMA @ 1.3385 and 200 SMA @ 1.3453.
| Trends | Trends.1 | |
|---|---|---|
| 0 | Daily SMA20 | 1.3363 |
| 1 | Daily SMA50 | 1.3282 |
| 2 | Daily SMA100 | 1.3385 |
| 3 | Daily SMA200 | 1.3453 |
The previous day high was 1.3575 while the previous day low was 1.3524. The daily 38.2% Fib levels comes at 1.3556, expected to provide resistance. Similarly, the daily 61.8% fib level is at 1.3544, expected to provide resistance.
Note the levels of interest below:
- Pivot support is noted at 1.3526, 1.35, 1.3476
- Pivot resistance is noted at 1.3577, 1.3601, 1.3627
| Levels | Levels.1 |
|---|---|
| Previous Daily High | 1.3575 |
| Previous Daily Low | 1.3524 |
| Previous Weekly High | 1.3575 |
| Previous Weekly Low | 1.3437 |
| Previous Monthly High | 1.3387 |
| Previous Monthly Low | 1.3093 |
| Daily Fibonacci 38.2% | 1.3556 |
| Daily Fibonacci 61.8% | 1.3544 |
| Daily Pivot Point S1 | 1.3526 |
| Daily Pivot Point S2 | 1.3500 |
| Daily Pivot Point S3 | 1.3476 |
| Daily Pivot Point R1 | 1.3577 |
| Daily Pivot Point R2 | 1.3601 |
| Daily Pivot Point R3 | 1.3627 |
[/s2If]
Download Nehcap EAWe have two EAs that are operational on our LIVE accounts.
- EA-FIX: Check out the details here. Download EA-FIX . EA-FIX is a non-grid HFT scalper.
- EA-GROWTH: High quality low dd EA using trend grids. Download EA_GROWTHJoin Our Telegram Group
")


