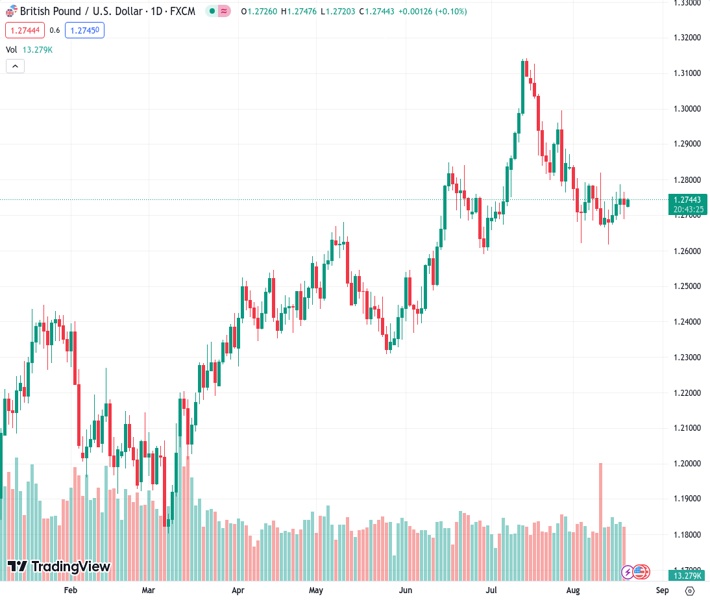
The GBPUSD pair, trading at a rate of 1.27457, continues to stay neutral after breaking a four-week decline trend.
…
This is a premium post.
[s2If !current_user_can(access_s2member_level4)]Please register for FREE REGISTER to read full post below containing analysis. In case of any error or you think you are not able to read the full post below, please email us at support#nehcap.com [lwa][/s2If] [s2If current_user_can(access_s2member_level1)]
- GBP/USD remains sidelined after snapping four-week downtrend.
The pair currently trades last at 1.27457.
The previous day high was 1.2766 while the previous day low was 1.2689. The daily 38.2% Fib levels comes at 1.2719, expected to provide support. Similarly, the daily 61.8% fib level is at 1.2737, expected to provide support.
GBP/USD buyers struggle to keep the reins after beating the bears the last week, following four consecutive weekly declines. With this, the Cable pair seesaws near 1.2740-30 amid the early hours of Monday’s Asian session after positing the first weekly gain in five. That said, the latest round of the UK housing and employment signals seem to join the market’s cautious mood ahead of this week’s top-tier data/events to prod the Pound Sterling buyers.
As per the latest survey of the UK’s job search website Adjuna, vacancies and advertised starting salaries marked their first fall of 2023 in July. That said, Adjuna co-founder Andrew Hunter mentioned, per Reuters, “Whilst it’s natural to see vacancies fall during the summer months, as companies traditionally slow hiring, the early figures for July’s jobs data will demonstrate to UK policymakers that inflation truly should be on a downward trajectory.”
Additionally, the Rightmove House Price Index for August marked a sharp fall in the UK’s asking price for homes, down to -1.9% MoM from -0.2% prior. Details of the survey, shared by Reuters, cite the rising mortgage costs as the key catalysts for the slump in the prices.
During the last week, UK Retail Sales dropped for July but the wage growth and details for inflation numbers improved for the said month, which in turn fuelled the hawkish expectations from the Bank of England (BoE), which in turn seems to have fuelled the Pound Sterling after the data release.
It’s worth noting that the upbeat US second-tier manufacturing activity numbers, Retail Sales and wage growth allowed the US Dollar to remain firmer for the fifth consecutive week, especially backed by the hawkish Fed Minutes. Also keeping the Greenback firmer was the China-inflicted risk-off mood and the upbeat Treasury bond yields. With this, US Dollar Index (DXY) grew in the last five consecutive weeks, to 103.40 at the latest.
Against this backdrop, Wall Street closed mixed on Friday whereas the US Treasury bond yields retreat after a strongly negative week for the equities and the upbeat bound coupons. That said, the S&P500 Futures remain lackluster at the monthly low by the press time.
Looking ahead, a light calendar on Monday could join the recently downbeat UK catalysts to prod the GBP/USD buyers. However, major attention will be given to Wednesday’s preliminary readings of the August month Purchasing Managers Indexes (PMIs) and the central bankers’ speeches at the annual Jackson Hole Symposium event, scheduled between August 24 and 26.
Despite the previous week’s recovery from the 100-DMA support, around 1.2630 by the press time, the GBP/USD pair remains well beneath the 50-DMA hurdle surrounding the 1.2800 round figure, which in turn joins the bearish MACD signals to keep the Cable bears hopeful.
Technical Levels: Supports and Resistances
GBPUSD currently trading at 1.2742 at the time of writing. Pair opened at 1.2734 and is trading with a change of 0.06% % .
| Overview | Overview.1 | |
|---|---|---|
| 0 | Today last price | 1.2742 |
| 1 | Today Daily Change | 0.0008 |
| 2 | Today Daily Change % | 0.06% |
| 3 | Today daily open | 1.2734 |
The pair is trading below its 20 Daily moving average @ 1.2766, below its 50 Daily moving average @ 1.2788 , above its 100 Daily moving average @ 1.2628 and above its 200 Daily moving average @ 1.2379
| Trends | Trends.1 | |
|---|---|---|
| 0 | Daily SMA20 | 1.2766 |
| 1 | Daily SMA50 | 1.2788 |
| 2 | Daily SMA100 | 1.2628 |
| 3 | Daily SMA200 | 1.2379 |
The previous day high was 1.2766 while the previous day low was 1.2689. The daily 38.2% Fib levels comes at 1.2719, expected to provide support. Similarly, the daily 61.8% fib level is at 1.2737, expected to provide support.
Note the levels of interest below:
- Pivot support is noted at 1.2693, 1.2653, 1.2616
- Pivot resistance is noted at 1.277, 1.2807, 1.2847
| Levels | Levels.1 |
|---|---|
| Previous Daily High | 1.2766 |
| Previous Daily Low | 1.2689 |
| Previous Weekly High | 1.2788 |
| Previous Weekly Low | 1.2617 |
| Previous Monthly High | 1.3142 |
| Previous Monthly Low | 1.2659 |
| Daily Fibonacci 38.2% | 1.2719 |
| Daily Fibonacci 61.8% | 1.2737 |
| Daily Pivot Point S1 | 1.2693 |
| Daily Pivot Point S2 | 1.2653 |
| Daily Pivot Point S3 | 1.2616 |
| Daily Pivot Point R1 | 1.2770 |
| Daily Pivot Point R2 | 1.2807 |
| Daily Pivot Point R3 | 1.2847 |
[/s2If]
Download Nehcap EAWe have two EAs that are operational on our LIVE accounts.
- EA-FIX: Check out the details here. Download EA-FIX . EA-FIX is a non-grid HFT scalper.
- EA-GROWTH: High quality low dd EA using trend grids. Download EA_GROWTHJoin Our Telegram Group
")


