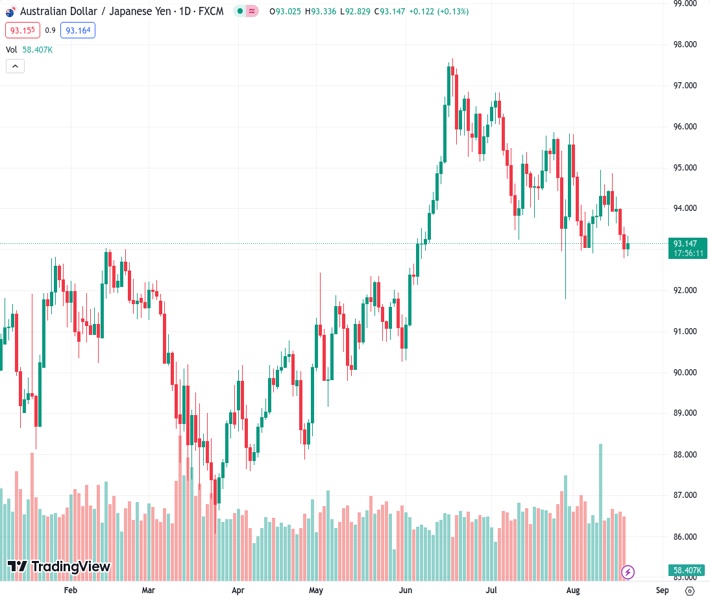
The AUDJPY pair is still under pressure above the 93.20 level following recent news about the Bank of Japan and a 10 bps rate cut by the People’s Bank of China.
…
This is a premium post.
[s2If !current_user_can(access_s2member_level4)]Please register for FREE REGISTER to read full post below containing analysis. In case of any error or you think you are not able to read the full post below, please email us at support#nehcap.com [lwa][/s2If] [s2If current_user_can(access_s2member_level1)]
- AUD/JPY remains on the defensive above the 93.20 mark following BoJ news, PBoC 10 basis point (bps) rate cut.
The pair currently trades last at 93.1740.
The previous day high was 93.58 while the previous day low was 92.79. The daily 38.2% Fib levels comes at 93.09, expected to provide support. Similarly, the daily 61.8% fib level is at 93.28, expected to provide resistance.
The AUD/JPY cross edges higher to the 93.28 mark during the Asian trading hours on Monday. The cross bounces off the 92.83 low following the Bank of Japan (BoJ) news and Chinese central bank rate cut.
That said, the BoJ will purchase Japanese Government Bonds (JBS) at a fixed rate for an unlimited quantity (Residual maturity of 5YR to 10YR) outright from August 22, according to Bloomberg. Furthermore, the People’s Bank of China (PBoC) decided to cut the one-year Loan Prime Rate (LPR) by 10 basis points (bos) to 3.45% from 3.555 and maintained the five-year LPR unchanged at 4.2%.
From a technical perspective, AUD/JPY trades within a descending trend channel line from the middle of June on the four-hour chart. That said, the path of least resistance for the AUD/JPY is to the downside as the cross holds below the 50- and 100-hour Exponential Moving Averages (EMAs). It’s worth noting that the Relative Strength Index (RSI) holds below 50, supporting the sellers for now.
The first resistance level for AUD/JPY emerges at 93.70 (50-hour EMA). The key barrier is located at 94.00, portraying a confluence of the 100-hour EMA and a psychological round figure. The additional upside filter to watch is 94.60 (the upper boundary of a descending trend channel). Any meaningful follow-through buying above the latter will see a rally to 94.90 (high of August 9) en route to 95.40 (high of July 14).
On the flip side, the cross will meet the initial support level at 92.80 (low of August 18). The next downside stop appears at 92.55 (low of July 88), followed by 92.15 (low of June 6). A breach of the latter will see a drop to 91.60 (the lower limit of a descending trend channel).
Technical Levels: Supports and Resistances
AUDJPY currently trading at 93.25 at the time of writing. Pair opened at 93.2 and is trading with a change of 0.05 % .
| Overview | Overview.1 | |
|---|---|---|
| 0 | Today last price | 93.25 |
| 1 | Today Daily Change | 0.05 |
| 2 | Today Daily Change % | 0.05 |
| 3 | Today daily open | 93.20 |
The pair is trading below its 20 Daily moving average @ 94.13, below its 50 Daily moving average @ 94.99 , above its 100 Daily moving average @ 92.81 and above its 200 Daily moving average @ 91.91
| Trends | Trends.1 | |
|---|---|---|
| 0 | Daily SMA20 | 94.13 |
| 1 | Daily SMA50 | 94.99 |
| 2 | Daily SMA100 | 92.81 |
| 3 | Daily SMA200 | 91.91 |
The previous day high was 93.58 while the previous day low was 92.79. The daily 38.2% Fib levels comes at 93.09, expected to provide support. Similarly, the daily 61.8% fib level is at 93.28, expected to provide resistance.
Note the levels of interest below:
- Pivot support is noted at 92.8, 92.4, 92.01
- Pivot resistance is noted at 93.59, 93.98, 94.38
| Levels | Levels.1 |
|---|---|
| Previous Daily High | 93.58 |
| Previous Daily Low | 92.79 |
| Previous Weekly High | 94.87 |
| Previous Weekly Low | 92.79 |
| Previous Monthly High | 96.84 |
| Previous Monthly Low | 91.79 |
| Daily Fibonacci 38.2% | 93.09 |
| Daily Fibonacci 61.8% | 93.28 |
| Daily Pivot Point S1 | 92.80 |
| Daily Pivot Point S2 | 92.40 |
| Daily Pivot Point S3 | 92.01 |
| Daily Pivot Point R1 | 93.59 |
| Daily Pivot Point R2 | 93.98 |
| Daily Pivot Point R3 | 94.38 |
[/s2If]
Download Nehcap EAWe have two EAs that are operational on our LIVE accounts.
- EA-FIX: Check out the details here. Download EA-FIX . EA-FIX is a non-grid HFT scalper.
- EA-GROWTH: High quality low dd EA using trend grids. Download EA_GROWTHJoin Our Telegram Group
")


