Gold price is experiencing consolidation due to the decreased US yields and a preference for lower-risk investments.
…
This is a premium post.
[s2If !current_user_can(access_s2member_level4)]Please register for FREE REGISTER to read full post below containing analysis. In case of any error or you think you are not able to read the full post below, please email us at support#nehcap.com [lwa][/s2If] [s2If current_user_can(access_s2member_level1)]
- Gold price consolidates as an effect of declined US yields and risk aversion.
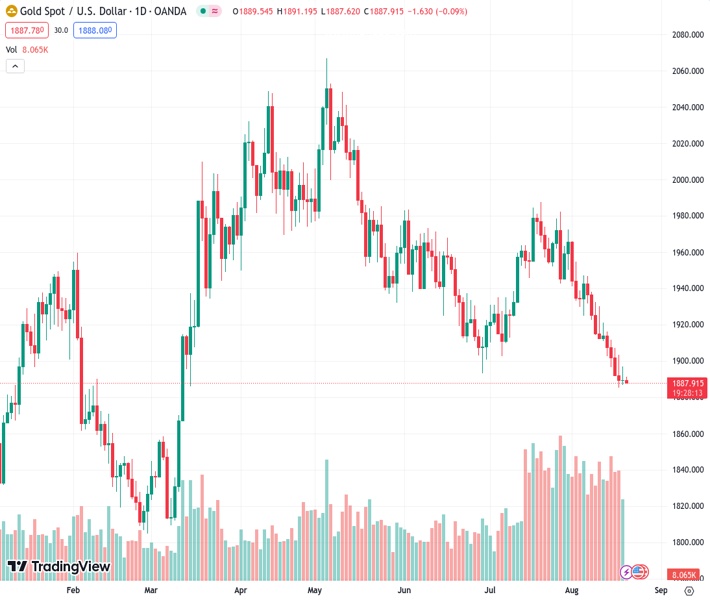
The pair currently trades last at 1887.63.
The previous day high was 1896.92 while the previous day low was 1886.83. The daily 38.2% Fib levels comes at 1893.07, expected to provide resistance. Similarly, the daily 61.8% fib level is at 1890.68, expected to provide resistance.
Gold price struggles to snap a losing streak, treading waters near $1,890 per troy ounce during the Asian session on Monday. The Gold is also benefiting from the retreating US Dollar (USD), driven by a decline in US Treasury yields and risk aversion.
However, the price of Gold experienced downward pressure on Friday due to upbeat United States (US) economic data, leading to cautious market sentiment as traders remain vigilant for more cues regarding the inflation outlook. The Gold price could face a challenge due to China’s economic woes. These elements could potentially impact the overall trajectory of Gold prices.
Investors seek additional indications that could provide them with a clearer understanding of the potential direction of the US Federal Reserve (Fed) regarding monetary policy in September’s meeting. This suggests that caution persists in the market, leading traders to remain uncertain and seek more information before making definitive decisions.
The People’s Bank of China (PBoC) reduced interest rates by 10 basis points (bps) against the market expectation of a 15 bps reduction on Monday. Investors’ sentiment could be heavily influenced by the PBOC’s decision and broader trends in China’s economy. In spite of the cautious Chinese policymakers, the market anticipates more interest rate reductions and broader relaxation measures in the months ahead. This situation could provide support to the price of Gold, which is already under pressure.
The US Dollar Index (DXY), which measures the performance of the Greenback against the six major currencies, hovers around 103.40. The US Dollar (USD) trades sideways despite strong US data, prompting a sense of caution in the market as it seeks further signals about the inflation scenario.
In the upcoming week, investors will likely monitor the release of US economic data, particularly Home Sales and the preliminary S&P Global PMI surveys for August along with Fed Chair Jerome Powell’s speech on Friday during the Jackson Hole Symposium. This event could provide insights into the state of the US economy, helping to shape potential strategies for placing new bets on the Gold.
Technical Levels: Supports and Resistances
XAUUSD currently trading at 1888.26 at the time of writing. Pair opened at 1889.62 and is trading with a change of -0.07 % .
| Overview | Overview.1 | |
|---|---|---|
| 0 | Today last price | 1888.26 |
| 1 | Today Daily Change | -1.36 |
| 2 | Today Daily Change % | -0.07 |
| 3 | Today daily open | 1889.62 |
The pair remains strongly bearish on the daily time frame. It trades below the 20 SMA @ 1930.01, 50 SMA 1935.14, 100 SMA @ 1962.66 and 200 SMA @ 1906.71.
| Trends | Trends.1 | |
|---|---|---|
| 0 | Daily SMA20 | 1930.01 |
| 1 | Daily SMA50 | 1935.14 |
| 2 | Daily SMA100 | 1962.66 |
| 3 | Daily SMA200 | 1906.71 |
The previous day high was 1896.92 while the previous day low was 1886.83. The daily 38.2% Fib levels comes at 1893.07, expected to provide resistance. Similarly, the daily 61.8% fib level is at 1890.68, expected to provide resistance.
Note the levels of interest below:
- Pivot support is noted at 1885.33, 1881.03, 1875.24
- Pivot resistance is noted at 1895.42, 1901.21, 1905.51
| Levels | Levels.1 |
|---|---|
| Previous Daily High | 1896.92 |
| Previous Daily Low | 1886.83 |
| Previous Weekly High | 1916.29 |
| Previous Weekly Low | 1885.13 |
| Previous Monthly High | 1987.54 |
| Previous Monthly Low | 1902.77 |
| Daily Fibonacci 38.2% | 1893.07 |
| Daily Fibonacci 61.8% | 1890.68 |
| Daily Pivot Point S1 | 1885.33 |
| Daily Pivot Point S2 | 1881.03 |
| Daily Pivot Point S3 | 1875.24 |
| Daily Pivot Point R1 | 1895.42 |
| Daily Pivot Point R2 | 1901.21 |
| Daily Pivot Point R3 | 1905.51 |
[/s2If]
Download Nehcap EAWe have two EAs that are operational on our LIVE accounts.
- EA-FIX: Check out the details here. Download EA-FIX . EA-FIX is a non-grid HFT scalper.
- EA-GROWTH: High quality low dd EA using trend grids. Download EA_GROWTHJoin Our Telegram Group
")


