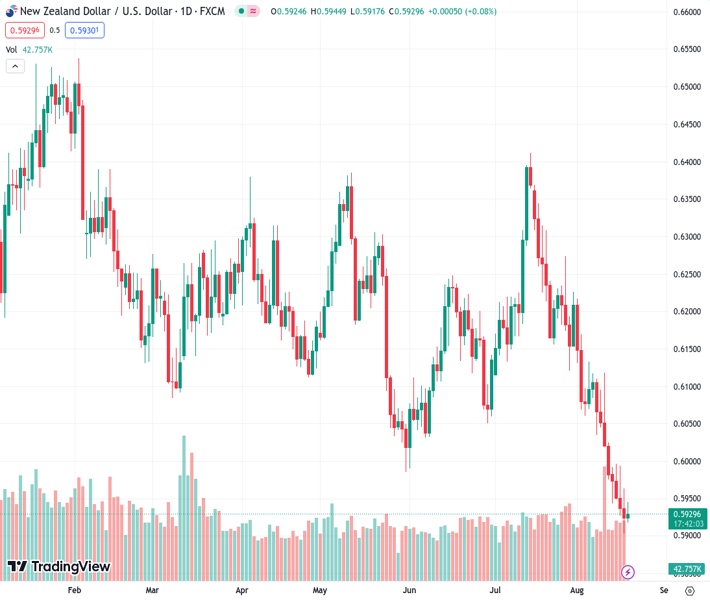
The NZDUSD currency pair has risen from its lowest point of the year reached on Thursday, but it is not showing strong momentum.
…
This is a premium post.
[s2If !current_user_can(access_s2member_level4)]Please register for FREE REGISTER to read full post below containing analysis. In case of any error or you think you are not able to read the full post below, please email us at support#nehcap.com [lwa][/s2If] [s2If current_user_can(access_s2member_level1)]
- NZD/USD recovers further from the YTD trough touched on Thursday, though lacks follow-through.
The pair currently trades last at 0.59301.
The previous day high was 0.5967 while the previous day low was 0.5903. The daily 38.2% Fib levels comes at 0.5927, expected to provide support. Similarly, the daily 61.8% fib level is at 0.5942, expected to provide resistance.
The NZD/USD pair builds on the previous day’s modest bounce from the 0.5900 mark, or its lowest level since November 2022 and gains some positive traction during the Asian session on Friday. Spot prices currently trade around the 0.5935 region, up 0.15% for the day, and for now, seem to have snapped an eight-day losing streak, through the intraday uptick lacks bullish conviction.
China Evergrande – one of the country’s biggest real estate developers – filed for protection from creditors in a US bankruptcy court on Thursday. The news adds to concerns about a deepening crisis in China’s property sector and the worsening conditions in the world’s second-largest economy, fueling hopes for more government stimulus. This, in turn, lends some support to antipodean currencies, including the New Zealand Dollar (NZD), which is seen drawing additional support from the Reserve Bank of New Zealand’s (RBNZ) hawkish outlook.
It is worth recalling that the RBNZ indicated on Wednesday that interest rates will remain at a restrictive level for some time and now forecasts the key Official Cash Rate (OCR) to remain at 5.5% through December 2024. Apart from this, a mildly softer tone surrounding the US Dollar (USD), assists the NZD/USD pair to attract some buying on the last day of the week. The USD downtick, meanwhile, could be attributed to a modest pullback in the US Treasury bond yields, though bets for further tightening by the Federal Reserve (Fed) should limit losses.
In fact, the minutes of the July 25-26 FOMC policy meeting released on Wednesday revealed that policymakers, though were divided over the need for more rate hikes, continued to prioritize the battle against inflation. Moreover, the incoming US macro data pointed to an extremely resilient economy and should allow the Fed to keep rates higher for longer. This acts as a tailwind for the US bond yields and the USD, which, in turn, is holding back traders from placing aggressive bullish bets around the NZD/USD pair and capping the upside.
Moving ahead, there isn’t any relevant market-moving economic data due for release from the US on Friday, leaving the USD at the mercy of the USD price dynamics. Apart from this, the broader risk sentiment might further contribute to producing short-term opportunities around the NZD/USD pair. Nevertheless, spot prices remain on track to register losses for the fifth successive week as the focus now shifts to next week’s release of the flash PMI prints and the highly-anticipated Jackson Hole Symposium.
Technical Levels: Supports and Resistances
NZDUSD currently trading at 0.5937 at the time of writing. Pair opened at 0.5927 and is trading with a change of 0.17 % .
| Overview | Overview.1 | |
|---|---|---|
| 0 | Today last price | 0.5937 |
| 1 | Today Daily Change | 0.0010 |
| 2 | Today Daily Change % | 0.1700 |
| 3 | Today daily open | 0.5927 |
The pair remains strongly bearish on the daily time frame. It trades below the 20 SMA @ 0.6088, 50 SMA 0.6155, 100 SMA @ 0.6173 and 200 SMA @ 0.6233.
| Trends | Trends.1 | |
|---|---|---|
| 0 | Daily SMA20 | 0.6088 |
| 1 | Daily SMA50 | 0.6155 |
| 2 | Daily SMA100 | 0.6173 |
| 3 | Daily SMA200 | 0.6233 |
The previous day high was 0.5967 while the previous day low was 0.5903. The daily 38.2% Fib levels comes at 0.5927, expected to provide support. Similarly, the daily 61.8% fib level is at 0.5942, expected to provide resistance.
Note the levels of interest below:
- Pivot support is noted at 0.5898, 0.5868, 0.5834
- Pivot resistance is noted at 0.5961, 0.5996, 0.6025
| Levels | Levels.1 |
|---|---|
| Previous Daily High | 0.5967 |
| Previous Daily Low | 0.5903 |
| Previous Weekly High | 0.6118 |
| Previous Weekly Low | 0.5974 |
| Previous Monthly High | 0.6413 |
| Previous Monthly Low | 0.6120 |
| Daily Fibonacci 38.2% | 0.5927 |
| Daily Fibonacci 61.8% | 0.5942 |
| Daily Pivot Point S1 | 0.5898 |
| Daily Pivot Point S2 | 0.5868 |
| Daily Pivot Point S3 | 0.5834 |
| Daily Pivot Point R1 | 0.5961 |
| Daily Pivot Point R2 | 0.5996 |
| Daily Pivot Point R3 | 0.6025 |
[/s2If]
Download Nehcap EAWe have two EAs that are operational on our LIVE accounts.
- EA-FIX: Check out the details here. Download EA-FIX . EA-FIX is a non-grid HFT scalper.
- EA-GROWTH: High quality low dd EA using trend grids. Download EA_GROWTHJoin Our Telegram Group
")


