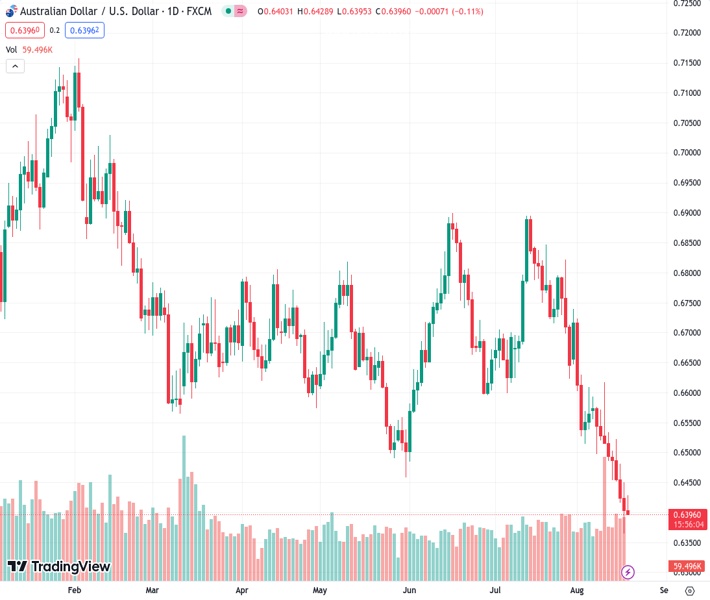
The AUDUSD pair is currently trading at 0.63982, experiencing an upward movement as it bounces back from the lowest point reached earlier in the week on Thursday.
…
This is a premium post.
[s2If !current_user_can(access_s2member_level4)]Please register for FREE REGISTER to read full post below containing analysis. In case of any error or you think you are not able to read the full post below, please email us at support#nehcap.com [lwa][/s2If] [s2If current_user_can(access_s2member_level1)]
- AUD/USD trades higher, rebounding from the weekly low marked on Thursday.
The pair currently trades last at 0.63982.
The previous day high was 0.645 while the previous day low was 0.6364. The daily 38.2% Fib levels comes at 0.6397, expected to provide support. Similarly, the daily 61.8% fib level is at 0.6418, expected to provide resistance.
AUD/USD consolidates above 0.6400 during the Asian session on Friday, rebounding from the low mark on Thursday. The Aussie might experience downward pressure as a result of the downbeat employment data from Australia released on Thursday.
The pair could face resistance around the 5-day Exponential Moving Average (EMA) at 0.6434 lined up with the 0.6450 psychological level. A break above the latter could underpin the AUD/USD pair to explore the 9-day EMA at 0.6470, followed by the 23.6% Fibonacci retracement at 0.6489.
On the downside, the weekly low at 0.6364 emerges as the immediate support aligned to the 0.6350 psychological level. The Moving Average Convergence Divergence (MACD) line stays in the negative territory of the centerline and shows divergence below the signal line, which indicates the bearish sentiment in the AUD/USD pair.
Additionally, the 14-day Relative Strength Index (RSI) continues to remain below 50, reinforcing the confirmation of the bearish bias of the AUD/USD traders.
Technical Levels: Supports and Resistances
AUDUSD currently trading at 0.6401 at the time of writing. Pair opened at 0.6404 and is trading with a change of -0.05 % .
| Overview | Overview.1 | |
|---|---|---|
| 0 | Today last price | 0.6401 |
| 1 | Today Daily Change | -0.0003 |
| 2 | Today Daily Change % | -0.0500 |
| 3 | Today daily open | 0.6404 |
The pair remains strongly bearish on the daily time frame. It trades below the 20 SMA @ 0.659, 50 SMA 0.6682, 100 SMA @ 0.6672 and 200 SMA @ 0.6736.
| Trends | Trends.1 | |
|---|---|---|
| 0 | Daily SMA20 | 0.6590 |
| 1 | Daily SMA50 | 0.6682 |
| 2 | Daily SMA100 | 0.6672 |
| 3 | Daily SMA200 | 0.6736 |
The previous day high was 0.645 while the previous day low was 0.6364. The daily 38.2% Fib levels comes at 0.6397, expected to provide support. Similarly, the daily 61.8% fib level is at 0.6418, expected to provide resistance.
Note the levels of interest below:
- Pivot support is noted at 0.6362, 0.632, 0.6276
- Pivot resistance is noted at 0.6448, 0.6492, 0.6534
| Levels | Levels.1 |
|---|---|
| Previous Daily High | 0.6450 |
| Previous Daily Low | 0.6364 |
| Previous Weekly High | 0.6617 |
| Previous Weekly Low | 0.6486 |
| Previous Monthly High | 0.6895 |
| Previous Monthly Low | 0.6599 |
| Daily Fibonacci 38.2% | 0.6397 |
| Daily Fibonacci 61.8% | 0.6418 |
| Daily Pivot Point S1 | 0.6362 |
| Daily Pivot Point S2 | 0.6320 |
| Daily Pivot Point S3 | 0.6276 |
| Daily Pivot Point R1 | 0.6448 |
| Daily Pivot Point R2 | 0.6492 |
| Daily Pivot Point R3 | 0.6534 |
[/s2If]
Download Nehcap EAWe have two EAs that are operational on our LIVE accounts.
- EA-FIX: Check out the details here. Download EA-FIX . EA-FIX is a non-grid HFT scalper.
- EA-GROWTH: High quality low dd EA using trend grids. Download EA_GROWTHJoin Our Telegram Group
")


